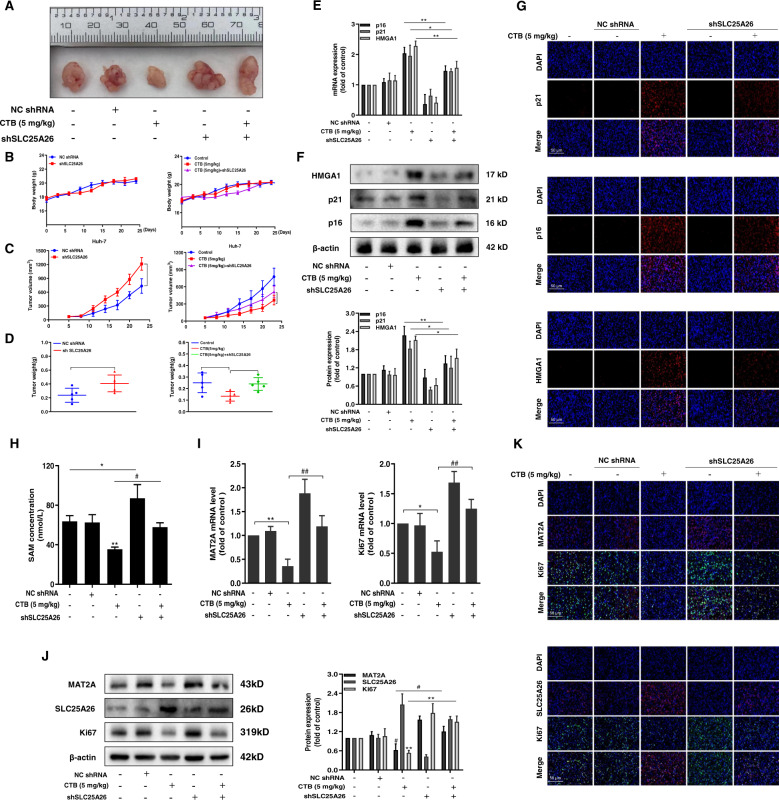
Fig. 7. CTB repressed tumorigenesis in vivo by regulating SLC25A26.
HCC cell line Huh-7 was used to construct subcutaneous xenografts. A Representative images of BALB/c nude mice tumors stripped from different groups (n = 6); B The body weight change curves of mice in each group during the whole experiment period (n = 6); C Tumor volume growth curves of mice in each group throughout the experimental period (n = 6); D Tumor weight was obtained after executing mice on the last day (n = 6); E Real-time PCR analysis of p16, p21, HMGA1 mRNA levels in tumor tissues; F Western blot was used to analyze the protein expression of p16, p21, HMGA1 in tumor tissues. Representative blots were from three independent experiments; G Immunofluorescence analyses of senescent makers p16, p21, HMGA1 in the tumor tissue; H Elisa kit analyzes SAM levels in the tumor tissue; I Real-time PCR analyses of MAT2A, Ki67 mRNA levels in tumor tissues. J Western blot was used to analyze the protein expression of MAT2A, SLC25A26, Ki67 in tumor tissues. Representative blots were from three independent experiments; K Immunofluorescence analyses of MAT2A, SLC25A26, Ki67 in tumor tissues; Scale bars are 50 μm. Statistical significance for this graph: *P < 0.05 vs. control, **P < 0.01 vs. control, #P < 0.05 vs. CTB (5 mg/kg) + shSLC25A26, ##P < 0.01 vs. CTB (5 mg/kg) + shSLC25A26.

