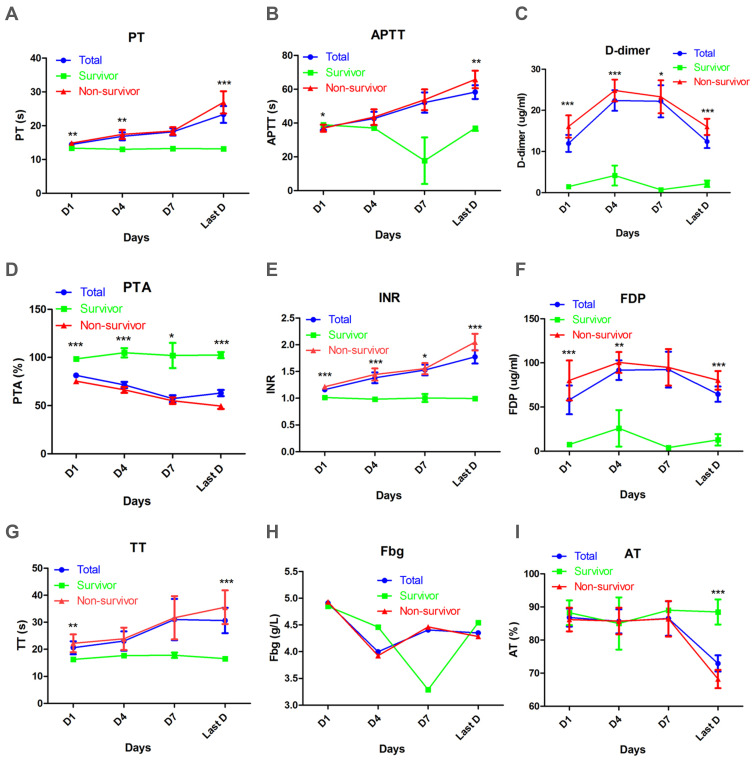
Figure 1.
Dynamic analysis of coagulation parameters in survivors, non-survivors, and all patients with COVID-19 in ICU. Absolute values of PT (A), APTT (B), d-dimer (C), PTA (D), INR (E), FDP (F), TT (G), Fbg (H), AT (I) of survivors (green), non-survivors (red) and all patients (blue) were analysed at different times after admission. Error bars, mean ± SEM, *p < 0.05, **p < 0.01, ***p < 0.001.

