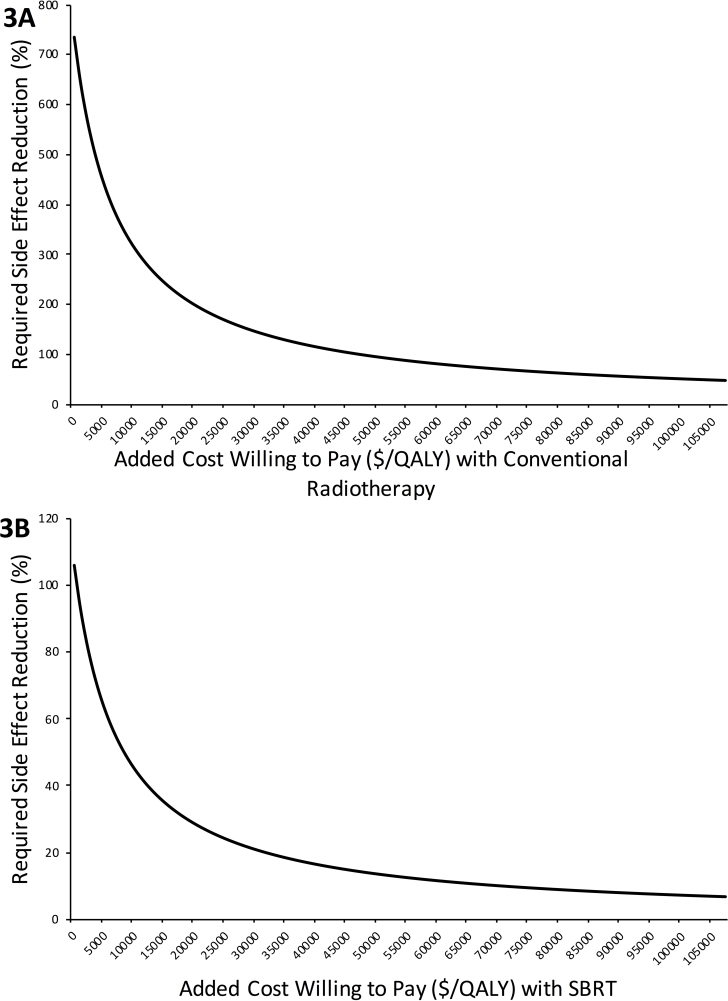
Figure 3.
Figures 3A and 3B demonstrate the side-effect reductions that are required for a range of added costs that healthcare systems may be willing to pay per QALY for MR-IGRT. These were generated with Equation 1 using the values for “incremental cost savings per 1% toxicity reduction” and “incremental QALYs gained per 1% toxicity reduction” obtained from Markov modeling and cost values obtained from the added cost assessment. Figure 3A is for conventionally fractionated MR-IGRT and Figure 3B is for SBRT. MR-IGRT, MRI-guided radiotherapy; QALY, quality adjusted life year; SBRT, stereotactic body radiotherapy.

