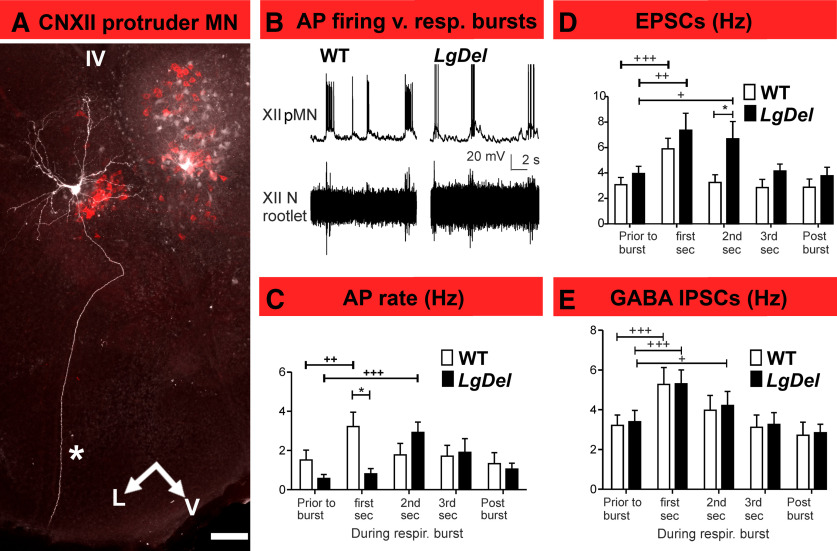
Figure 4.
Delayed inspiratory burst-related LgDel protruder MN activity. A, A confocal image of a pMN labeled by intracellular injection with biocytin, after identification using retrograde tracing with CTB-Alexa Fluor 555 (red). The asterisk indicates the single axon extending from this pMN to exit in the ventromedial region of the posterior medulla. Scale bar: 100 μm. V: ventral, L: lateral, IV: fourth ventricle. B, Representative traces showing the relationship between pMN AP activity (top traces) and fictive respiratory bursts recorded at CNXII rootlets (bottom traces) in WT versus LgDel neonatal mice. C, Histograms of AP firing in WT (white bars) and LgDel (black bars) pMNs before, during, and after inspiratory bursts. WT protruder MN AP firing increased in the first 1-s postburst interval (prior: 1.52 ± 0.5 Hz, first second 3.22 ± 0.7 Hz, one-way repeated measures ANOVA with Dunnett’s multiple comparison post hoc test, p = 0.0014, DFn = 4, DFd = 49, F = 5.538), whereas LgDel protruder MNs AP firing increased in the second, but not first, 1-s postburst interval (prior: 0.7 ± 0.1 Hz, first second 0.8 ± 0.1 Hz, second second 2.9 ± 0.7 Hz, one-way repeated measures ANOVA with Dunnett’s multiple comparison post hoc test, p = 0.0009, DFn = 4, DFd = 39, F = 6.408). The AP firing was higher in WT (3.22 ± 0.7 Hz) than in LgDel (0.8 ± 0.1 Hz) at the first 1-s postburst interval (two-way ANOVA with Bonferroni post hoc test, p < 0.05). D, Histograms of EPSC frequency in WT and LgDel pMNs before, during, and after inspiratory bursts. EPSC frequency from WT and LgDel pups increases significantly during the first 1-s postinspiratory burst interval (WT: prior: 3.1 ± 0.5 Hz, first second 5.9 ± 0.8 Hz, second second 3.3 ± 0.5 Hz, one-way repeated measures ANOVA with Dunnett’s multiple comparison post hoc test, DFn = 4, DFd = 59, F = 15.76, p < 0.0001; LgDel protruder MNs: prior: 3.97 ± 0.5 Hz, first second 7.37 ± 1.3 Hz, second second 6.7 ± 1.3 Hz, one-way repeated measures ANOVA with Dunnett’s multiple comparison post hoc test, DFn = 4, DFd = 44, F = 6.909, p = 0.0004); however, LgDel pMN EPSC frequency continued at significantly elevated levels through the second 1-s postburst interval compared with WT (6.7 ± 1.3 Hz in LgDel vs 3.3 ± 0.5 Hz in WT, p < 0.05, two-way ANOVA with Bonferroni post hoc test). E, GABAergic IPSC frequency histograms of WT and LgDel protruder MNs. IPSC frequency increased significantly during the first 1-s postburst interval in WT (prior: 3.2 ± 0.5 Hz, first second 5.3 ± 0.8 Hz, second second 4.0 ± 0.7 Hz, one-way repeated measures ANOVA with Dunnett’s multiple comparison post hoc test, DFn = 4, DFd = 44, F = 13.55, p < 0.0001) and LgDel pups (prior: 3.7 ± 0.5 Hz, first second 5.8 ± 0.6 Hz, second second 4.7 ± 0.6 Hz, one-way repeated measures ANOVA with Dunnett’s multiple comparison post hoc test, DFn = 4, DFd = 49, F = 16.96, p < 0.0001). Data expressed as mean ± SEM; Comparison between WT and LgDel group; *p < 0.05. Comparison among different time points within same group; +p < 0.05, ++p < 0.01, +++p < 0.001.

