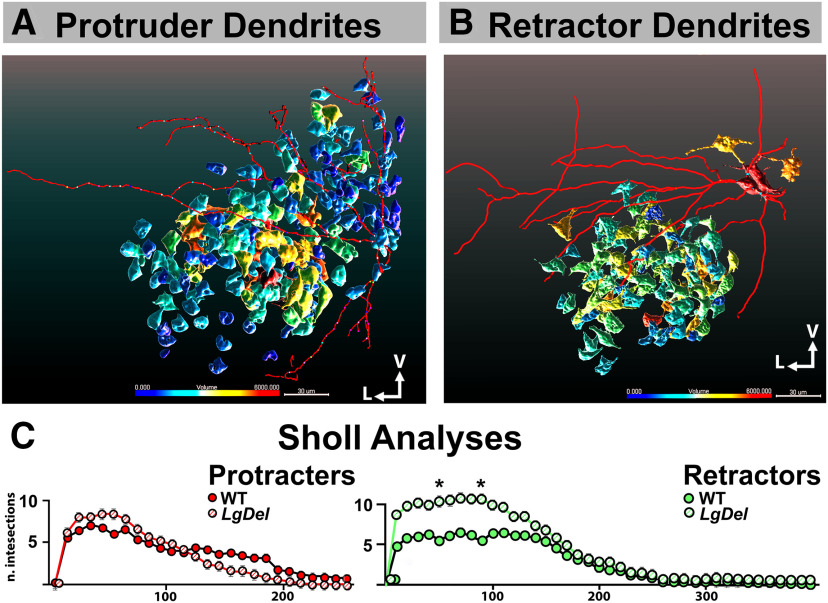
Figure 6.
Changes in retractor CNXII MNs cell soma and dendritic arborization in the hypoglossal nucleus of LgDel mouse pups. A, B, Representative confocal image renderings of a CNXII pMN (left) and rMN (right) after patch clamp recording followed by intracellular-labeled cell dendritic structure and soma volume in WT (pMN, left) or LgDel (rMN, right). The color coding illustrating the size of cell body volumes; V, ventral, L, lateral. Scale bar: 30 μm. C, Scholl analyses of CNXII pMN (left) and rMN (right) dendritic branching showing statistic difference only in rMN but not in pMN, the total numbers of dendritic intersections at 50- and 90-μm radii were significantly greater in LgDel than WT retractor MNs; at 50 μm: 5.57 ± 0.4 in WT, 10.29 ± 1.4 in LgDel, t = 3.339, p < 0.05; at 90 μm: WT 5.42 ± 1.9, LgDel 10.58 ± 2.1, t = 3.642, p < 0.05, two-way RM ANOVA with Bonferroni post hoc tests. Data presented as Mean ± SED; *p < 0.05.

