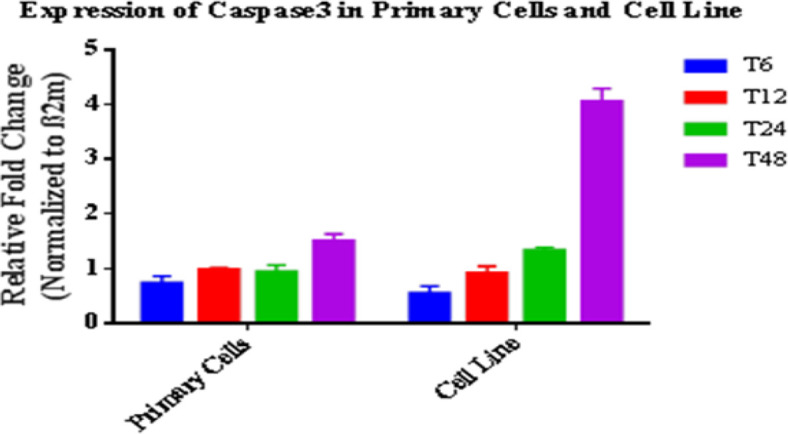
Fig. 2:

Caspase 3 expression profile in infected primary and cell line macrophages at 6, 12, 24 and 48 hours’ post-infection relatively to non-infected cells. Results were expressed using the 2−ΔΔCt method. Data are presented as mean ± SEM. Each experiment was performed in duplicate and columns represent their data
