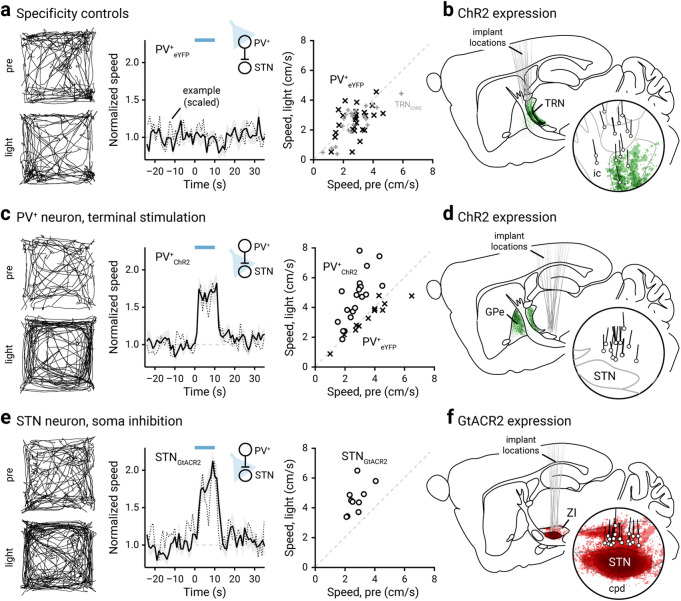
Figure 2.
Inhibition of STN promotes locomotion. a, Left, Movement tracks corresponding to the pre-period (top) and light-period (bottom). Six representative mice (10 trials from each) are presented. Middle, A plot showing the relationship between normalized speed and time. Blue bar indicates the duration (10 s) of light delivery. The dotted horizontal line indicates the baseline locomotor activity level. Black solid trace is the population mean calculated from all mice; shading indicates the SEM. Black dotted trace is a representative example from a single mouse; data were scaled to facilitate comparison. The same presentation scheme is used in c and e. Data from eYFP-expressing PV-Cre mice are shown; light was delivered to the GPe. Data from the same mice (crosses) are presented on the right in a scatterplot, which shows the speed during light delivery versus speed during pre-period. Mice with ChR2-expressed in TRN neurons are used as additional controls (gray pluses). b, Representation of targeted ChR2-eYFP expression patterns and fiber-optic implant locations in PV-Cre mice (n = 11). The TRN was targeted in these experiments. c, Left, middle, Data from optogenetic stimulation of PV+ neuron terminals in the STN are shown. Right, eYFP-expressing mice (in PV+ neurons) were used as controls (crosses). d, Representation of ChR2-eYFP expression patterns and fiber-optic implant locations in PV-Cre mice (n = 10). ChR2-expressing PV+ neuron terminals in the STN were targeted. e, Data from optogenetic inhibition of STN neurons with GtACR2 are shown. f, Representation of GtACR2-FusionRed expression patterns and fiber-optic implant locations in C57BL/6J mice (n = 10). The STN was targeted in these experiments. cpd, Cerebral peduncle; ic, internal capsule.

