
Figure 6.
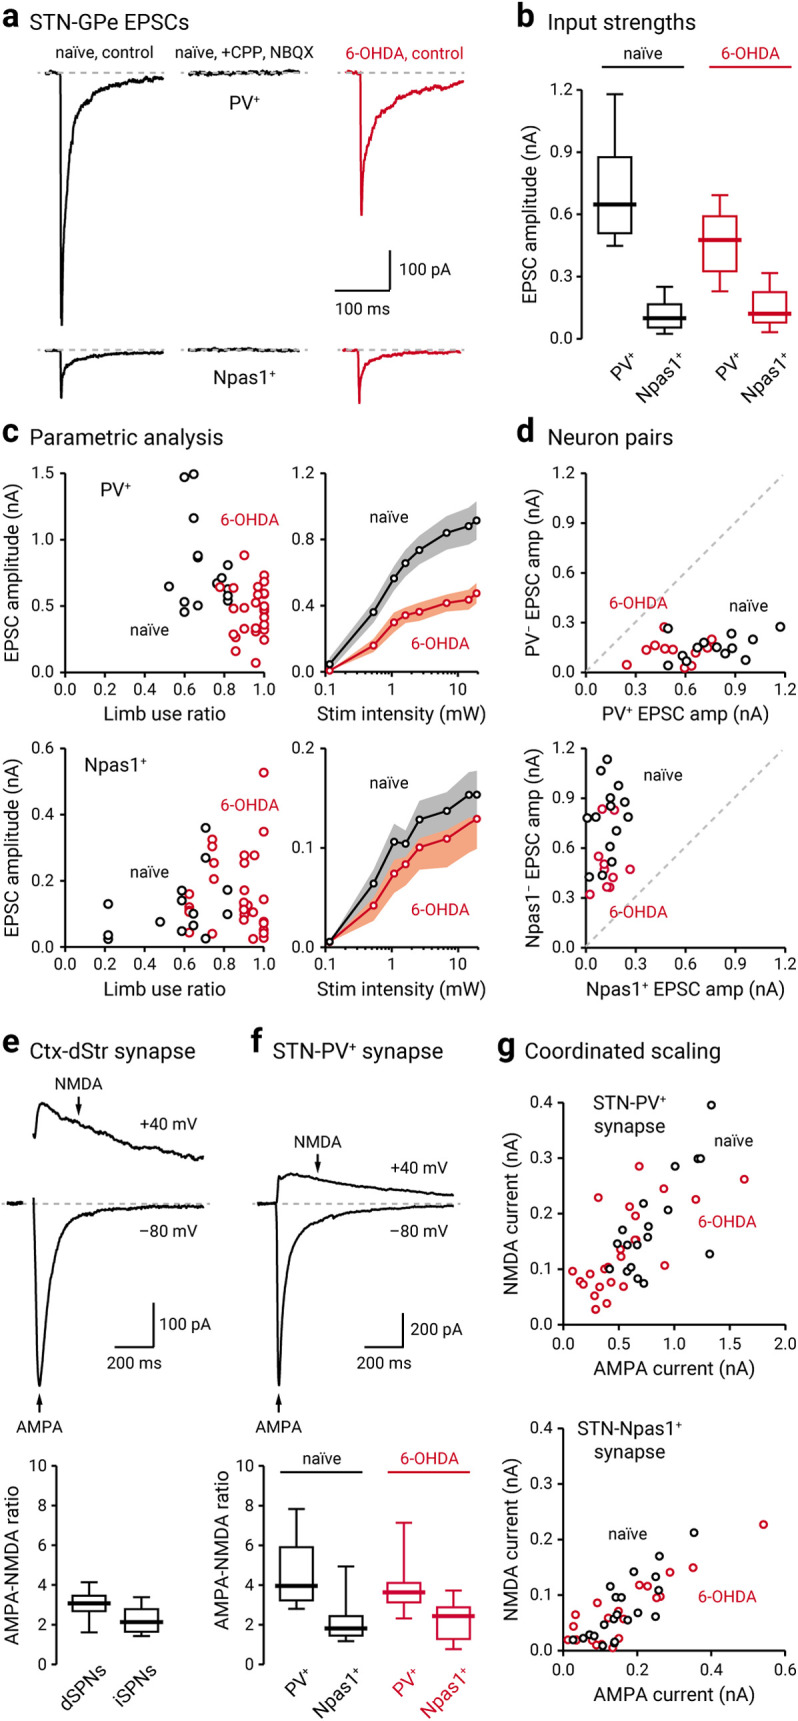
STN–GPe input is weakened following chronic 6-OHDA lesion. a, Left, Representative voltage-clamped recordings of a PV+ neuron (top) and a Npas1+ neuron (bottom) in naïve mice (black) showing that optogenetic stimulation of STN terminals evoked EPSCs. Middle, Application of CPP (10 μm) and NBQX (5 μm) completely eliminated the evoked EPSCs. Right, Representative EPSC recordings from a voltage-clamped PV+ neuron and a Npas1+ neuron in a chronic 6-OHDA lesioned mouse (red). b, Population data showing EPSC amplitudes measured from PV+ neurons and Npas1+ neurons. Data from naïve (black) and chronic 6-OHDA-lesioned (red) mice are shown. c, Left, EPSC amplitudes of PV+ neurons (top) or Npas1+ neurons (bottom) were plotted against limb use ratio, which provides a measure of the extent of the lesion. Each marker indicates a cell. Right, Input–output curves from EPSCs measured from PV+ neurons (top) and Npas1+ neurons (bottom). Each circle represents the mean EPSC amplitude measured at a particular light intensity, and the shaded area indicates SEM. d, Top, EPSC amplitudes measured from neighboring (within 150 µm apart) PV+ neurons and PV– neurons in naïve (black) and chronic 6-OHDA-lesioned (red) PV-L-tdTom mice. Bottom, EPSC amplitudes measured from neighboring Npas1+ neurons and Npas1– neurons in naïve (black) and chronic 6-OHDA-lesioned (red) Npas1-Cre-tdTom mice. Each marker represents a pair of positively and negatively identified neurons recorded from the same field. The dashed line represents the unity line. e, Top, Representative synaptic responses from a voltage-clamped SPN in the dStr. Corticostriatal (Ctx-Str) EPSCs were evoked with electrical stimulation; stimulus artifacts are not displayed. The gray line represents the baseline. Neurons were voltage clamped at –80 and +40 mV to measure AMPA and NMDA receptor-dependent currents, respectively. The stimulation artifact was removed for clarity. Bottom, Population data for AMPA-NMDA ratio in dSPNs and iSPNs. f, Top, Representative synaptic responses from a voltage-clamped PV+ neuron. EPSCs were measured with optogenetic stimulation of STN input. Note the relatively small NMDA current in the STN–PV+ input. Bottom, Population data for AMPA-NMDA ratio in PV+ neurons and Npas1+ neurons with stimulation of STN terminals in naïve (black) and chronic 6-OHDA-lesioned (red) mice. g, The relationship between NMDA current and AMPA current in PV+ neurons (top) and Npas1+ neurons (bottom; with stimulation of STN input) in naïve (black) and chronic 6-OHDA-lesioned (red) mice. Each marker represents a cell.