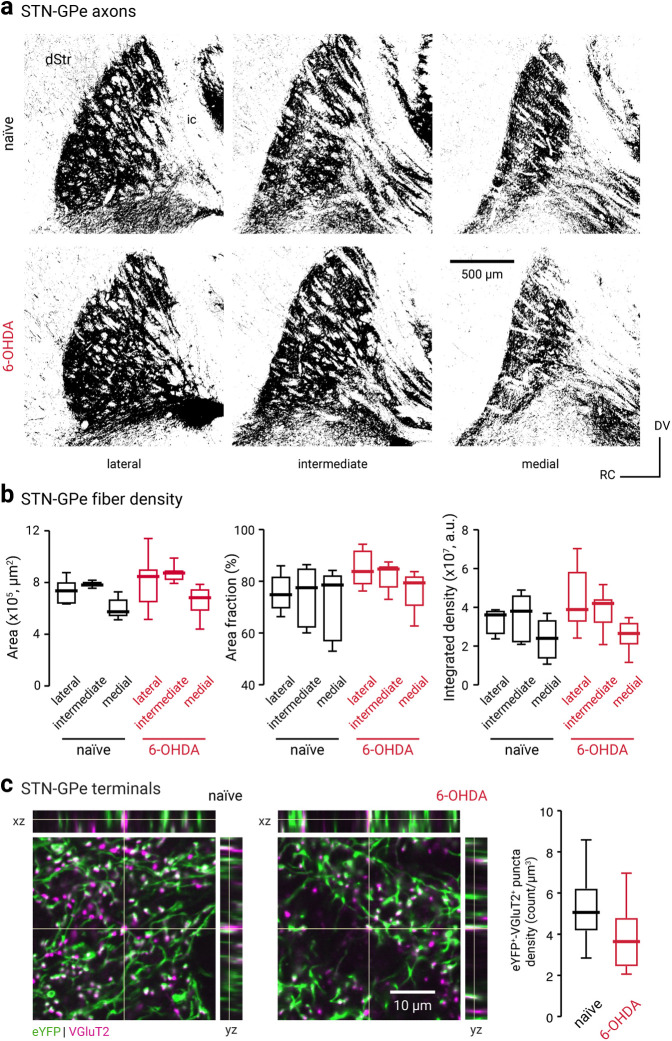
Figure 7.
The cell type specificity of STN–GPe EPSCs is not because of topographical biasing. a, Confocal micrographs showing the GPe in sagittal brain sections of a naïve (top, black) or chronic 6-OHDA-lesioned (bottom, red) C57BL/6J mice with ChR2-eYFP-expressing AAVs in the STN. Lateral, intermediate, and medial sections of the GPe are shown. ic, Internal capsule. b, Analysis of the eYFP signal in naïve (black) and chronic 6-OHDA-lesioned (red) mice. The surface area of the GPe (left), the percentage area covered by the eYFP signal (middle), and the integrated density of the eYFP signal (right) are quantified. c, Left and middle, Confocal micrographs showing the density of eYFP- and VGluT2-immunoreactive elements in the GPe from naïve and chronic 6-OHDA-lesioned mice. Breakout panels show orthogonal x–z projection (top) and y–z projection (right). Crosshairs indicate the pixel of interest. The colocalization of the signals is shown as white. Right, Box plots summarize the density of putative STN–GPe terminals in naïve (black) and chronic 6-OHDA-lesioned (red) mice.

