
Figure 1.
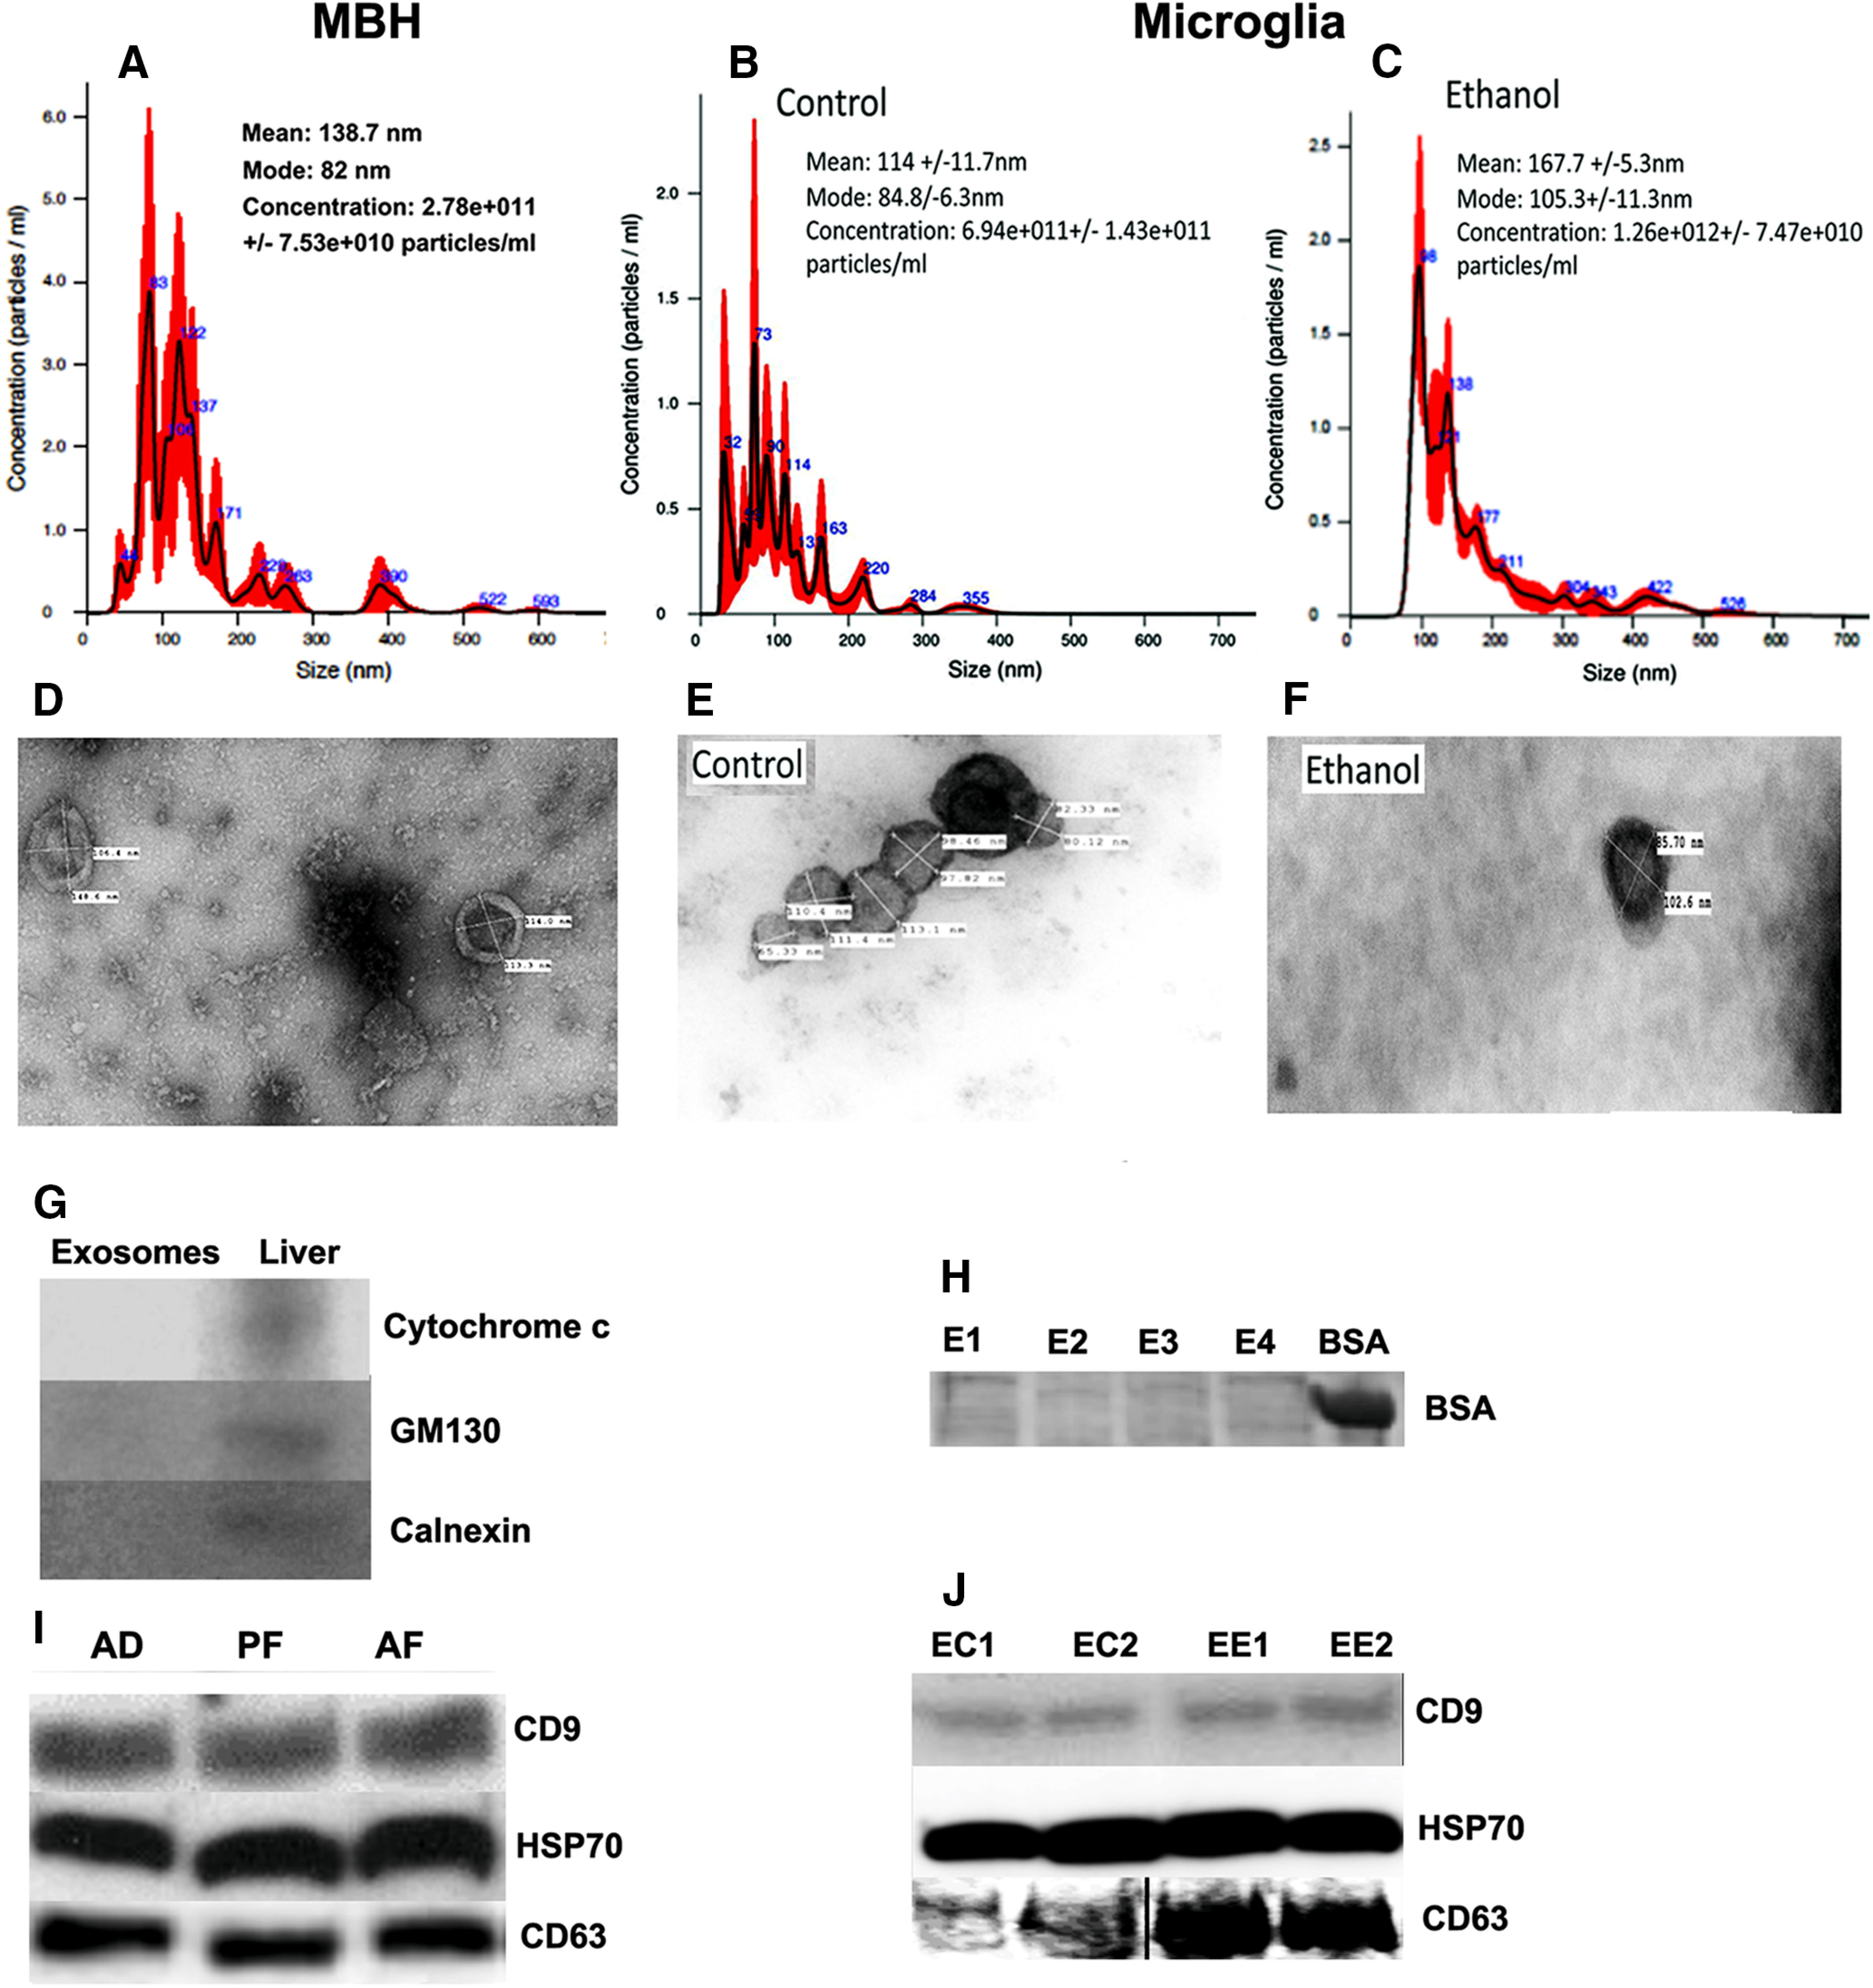
Characterization of hypothalamic and microglial exosomes; effects of alcohol. Nanoparticle tracking analysis, TEM, and Western blot verification of exosomes prepared from the tissue of MBH obtained from postnatal day 6 rats, which were fed daily with ethanol-containing milk formula (AF), pair-fed isocaloric milk formula (PF), or left undisturbed in the litter with mother (AD) (A, D, G, I); or from primary cultures of microglial cells treated with 50 mm ethanol for 24 h (B, C, E, F, H, J). For nanoparticle tracking analysis, the calculated size distribution is depicted as a mean (black line) with SE (red shaded area). Mean particle size, mode particle size, and concentration of particles in exosomes collected from MBH from AD rats (A) or microglia treated with vehicle control (B) or 50 mm ethanol (C). Representative images of exosomes from MBH of AD rats (D) and from control (E) or ethanol-treated microglia (F) under TEM. The width and length of each exosome are represented on the individual exosome. Representative bands for the protein levels of cellular proteins, mitochondria marker cytochrome c, Golgi apparatus marker GM130, and endoplasmic reticulum marker calnexin in MBH exosomes or in liver lysates (G) as determined by Western blot analysis. No BSA band was found in microglial-derived exosomes (H). Exosome marker proteins CD9, HSP70, and CD63 were detectable in Western blot analysis of exosomes prepared from MBH tissues of AD, PF, and AD rats (I) or from control (EC1, EC2) or ethanol (EE1, EE2)-treated microglial cultures (J). An equal amount of protein lysate was used from each group. Data represent three or more independent experiments.