Figure 4.

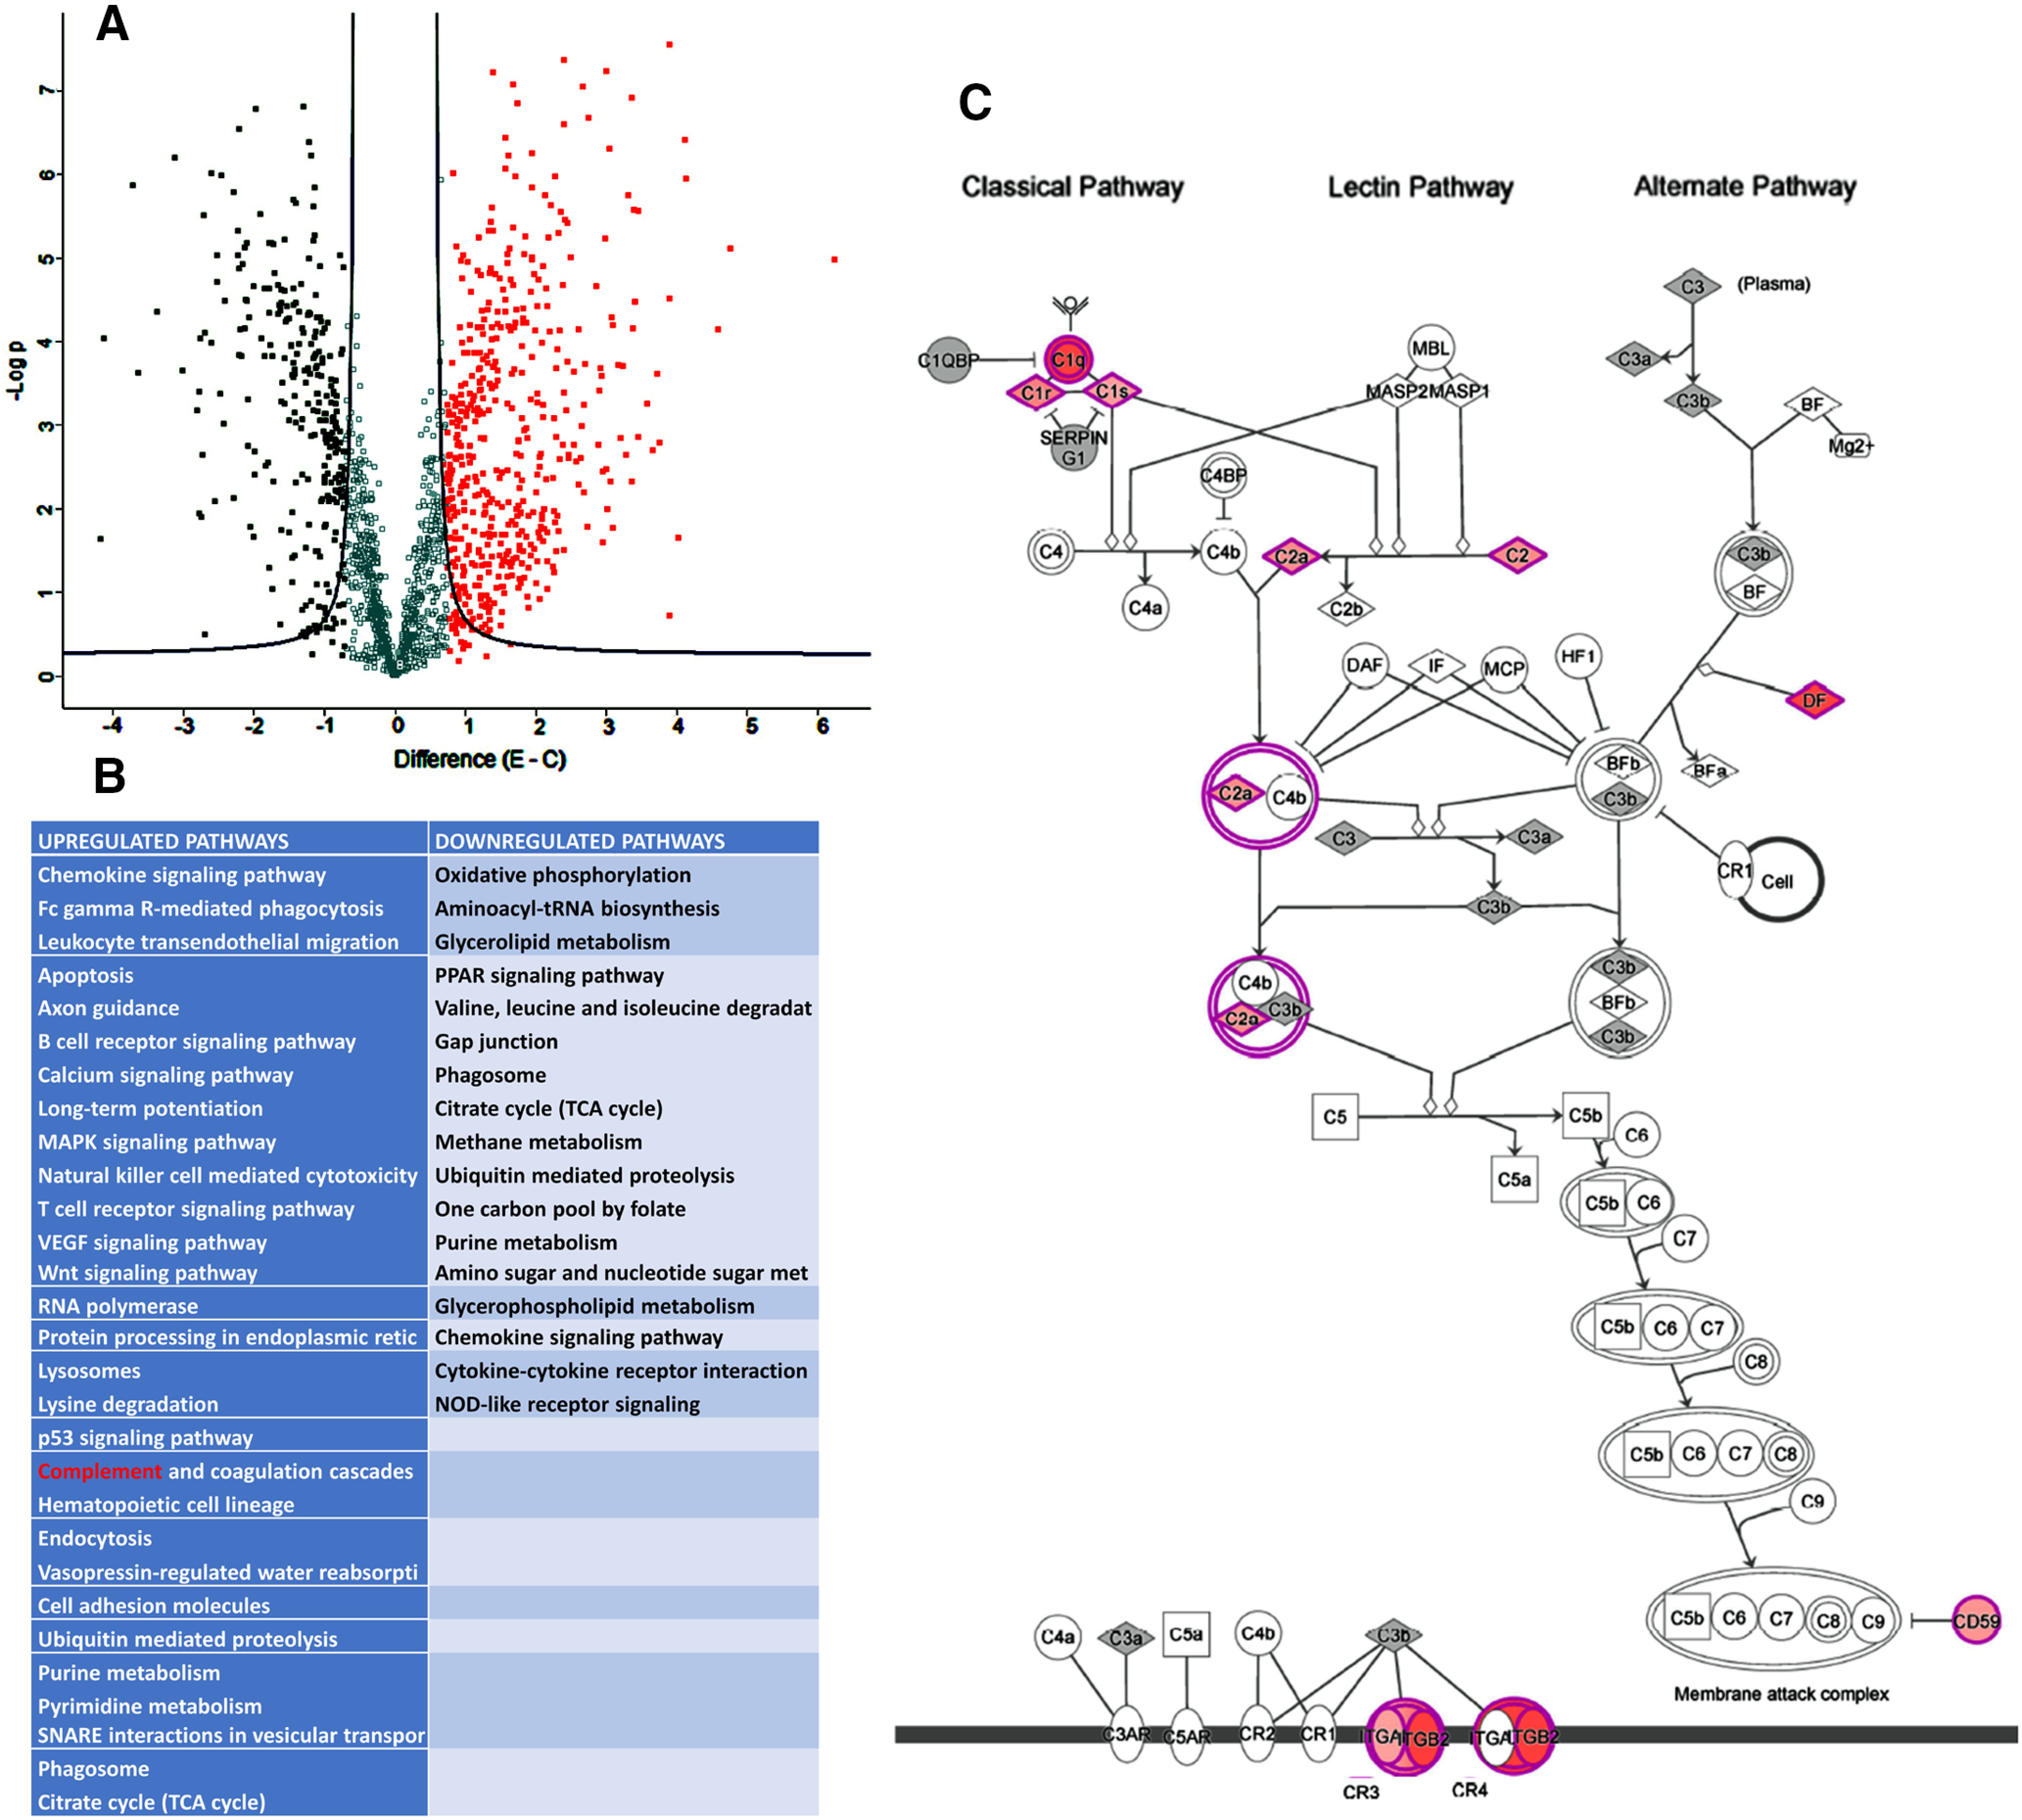
Proteomics characterization of exosome cargo from microglial cells treated with and without ethanol. Exosomes were prepared from primary microglia cells treated with 50 mm ethanol (E) or vehicle control (C) for 24 h and used for LC-MS/MS analysis. Comparative proteomic data were presented in a volcano plot, which was constructed by plotting the negative log of the p value on the y axis. Each dot represents the proteomes from three biological replicates per group. A, Volcano plot showed significant downregulated and upregulated proteins as determined by proteomic analysis in both ethanol and vehicle control. B, IPA identified the significantly affected canonical pathways, including complement pathways (highlighted in red), in ethanol-treated exosomes. C, The complement proteins, which are affected by ethanol (increase highlighted in pink; hub gene highlighted in red) in the complement pathway.
