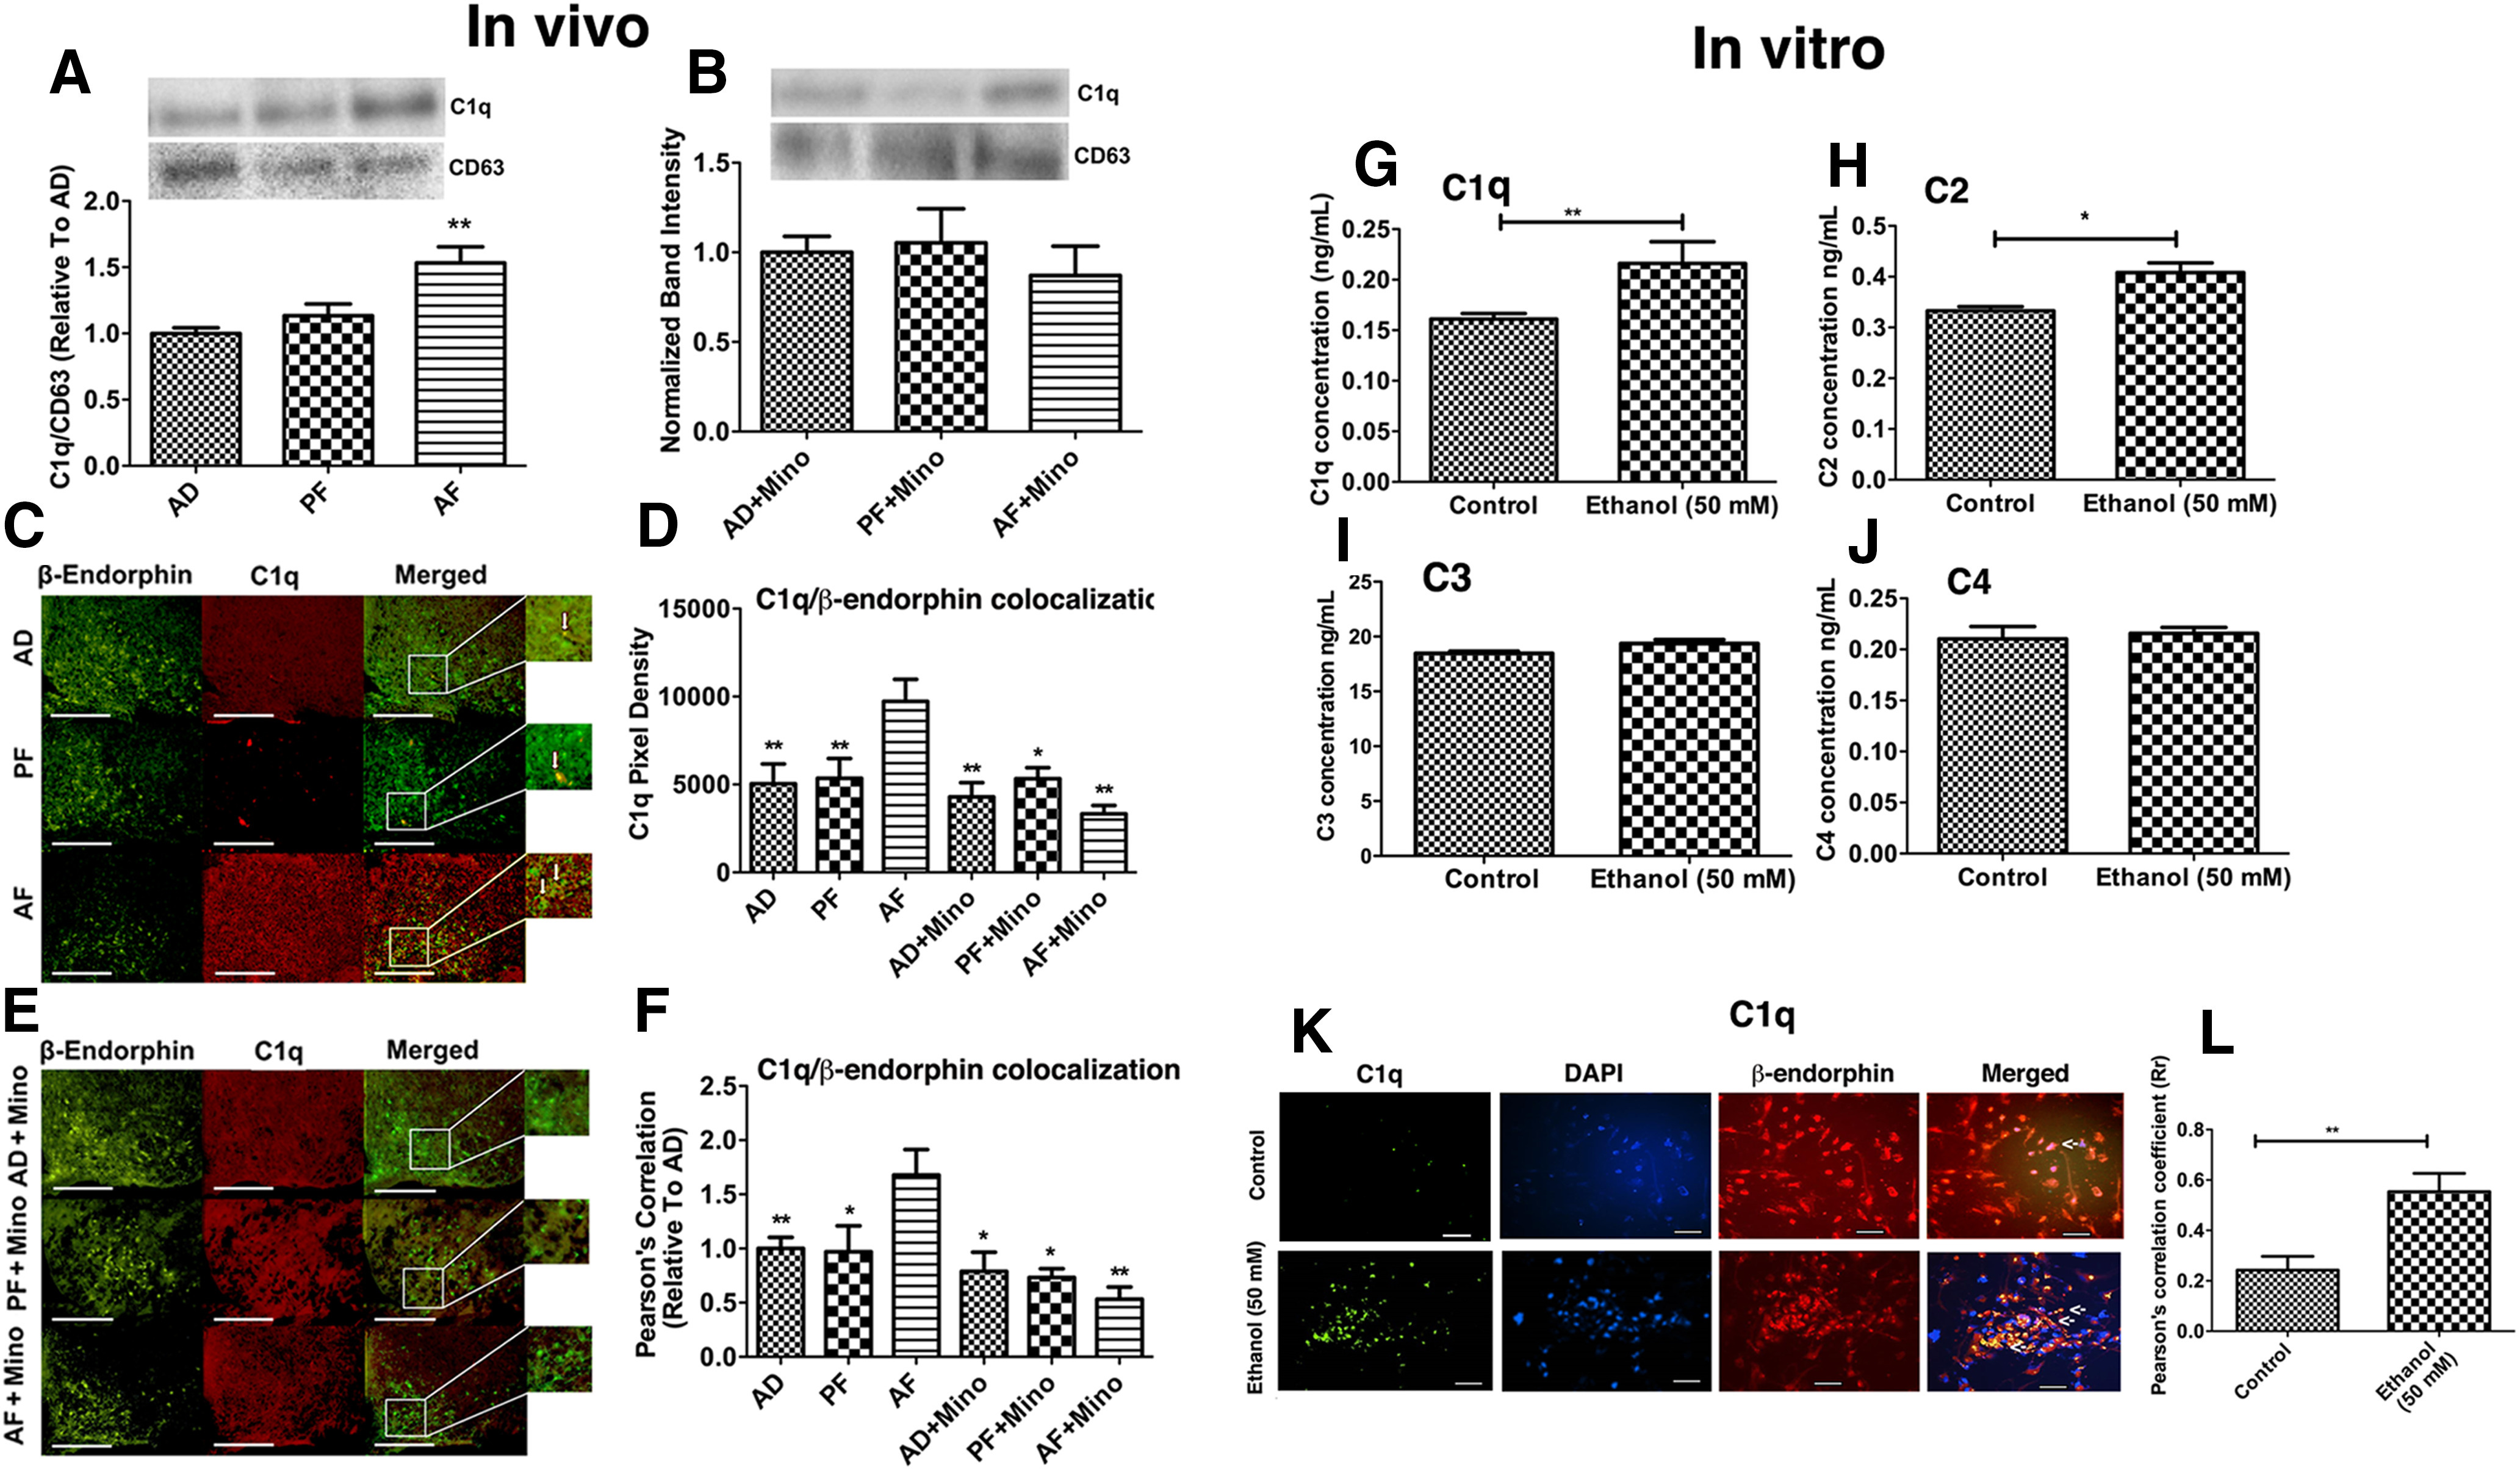
Figure 5.

Regulation of ethanol-induced changes in complement system in the hypothalamus. The effects of PAE with or without minocycline administration on C1q expression (A, B)and colocalization on β-endorphin neurons in the MBH (C–F), ethanol-induced changes in the levels of complements in exosomes derived from microglial cells in cultures (G–J), and ethanol-induced changes in deposition of microglia derived exosomal C1q on β-endorphin neurons in cultures (K, L). A, B, Bar graphs represent C1q protein levels along with representative bands for C1q and CD63 (used for normalizing C1q protein levels) (Kavanagh et al., 2017) measured by Western blot analysis. Histograms represent the mean ± SEM in AD, PF, AF, AD+Mino, PF+Mino, and AF+Mino rat pups on PND 6 (n = 5-8). **p< 0.01, AF versus AD, PF. C–F, Representative images of C1q-positive staining (red) and β-endorphin-positive staining (green), along with merged images and a zoomed-in picture to demonstrate colocalization. Scale bars, 200 µm. Histograms represent the mean ± SEM values of pixel density (D) or Pearson's correlation of C1q colocalization with β-endorphin (F) in AD, PF, AF, and AD+Mino, PF+Mino, and AF+Mino rat pups on PND 6 (n = 5-7). **p < 0.01 versus AF. *p < 0.01 versus AF. G–J, Histograms represent complement protein levels measured by ELISA in exosomes derived from microglial cells treated with vehicle (control) or 50 mm ethanol for 24 h. N = 4-6. *p < 0.05. **p < 0.01. Representative images of C1q-positive staining C1q-positive staining (Green) and β-endorphin-positive staining (Red) in β-endorphin neuronal culture after 24 h of incubation with exosomes harvested from control or ethanol-treated (50 mm) microglia cultures. Nucleus was stained with DAPI (blue). Arrows indicate C1q proteins inside the cells. Scale bars, 50 µm. Histograms represent the mean ± SEM values of Pearson's correlation of C1q colocalization with β-endorphin in cells of control and alcohol-treated groups. N = 6. **p < 0.01.
