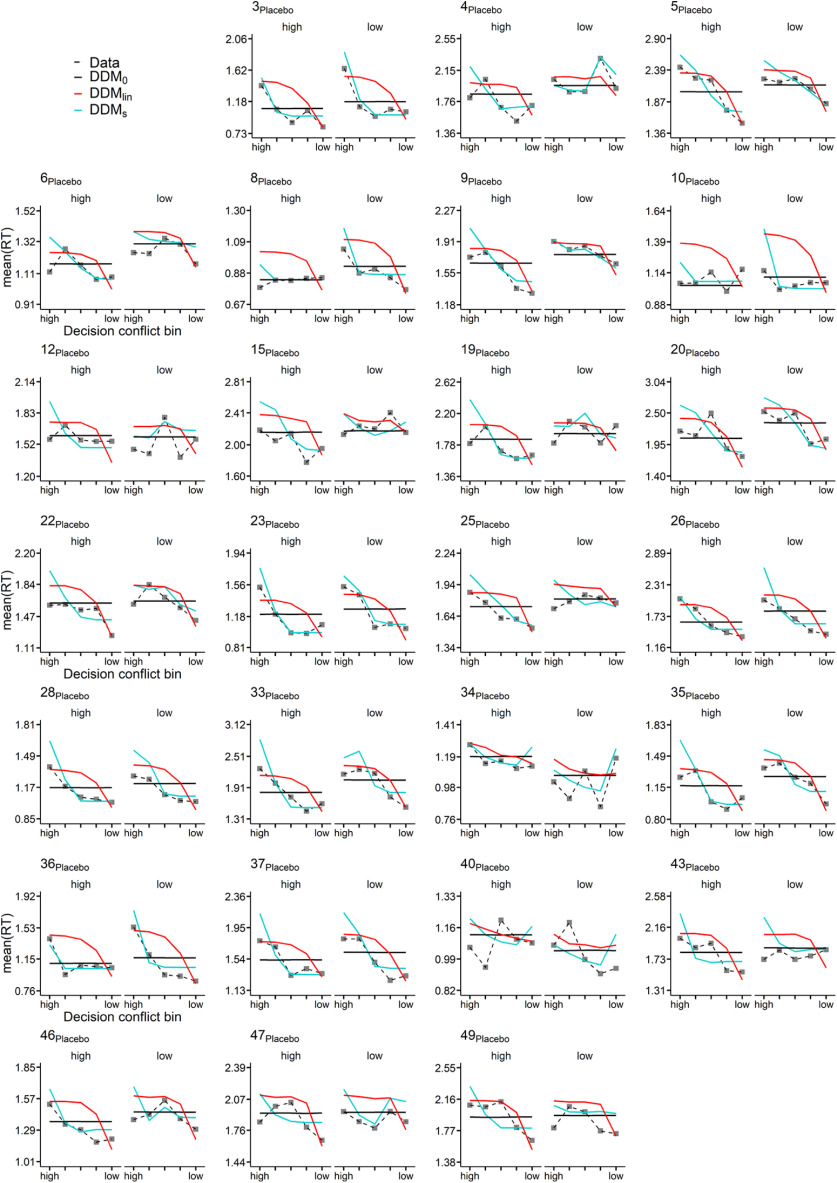
Figure 7.
Placebo condition posterior predictive checks. For each participant and condition (high (left facet) represents the high magnitude condition; low (right facet) represents the low magnitude condition), trials were binned into five equal sized bins according to the absolute difference in between subjective LL and SS options (decision conflict bin). Plotted are mean observed RTs per bin (data) as well model-generated RTs (blue represents DDM0; red represents DDMlin; orange represents DDMS) averaged >10,000 datasets simulated from the posterior distribution of each hierarchical model (blue represents DDM0; red represents DDMlin; orange represents DDMs).

