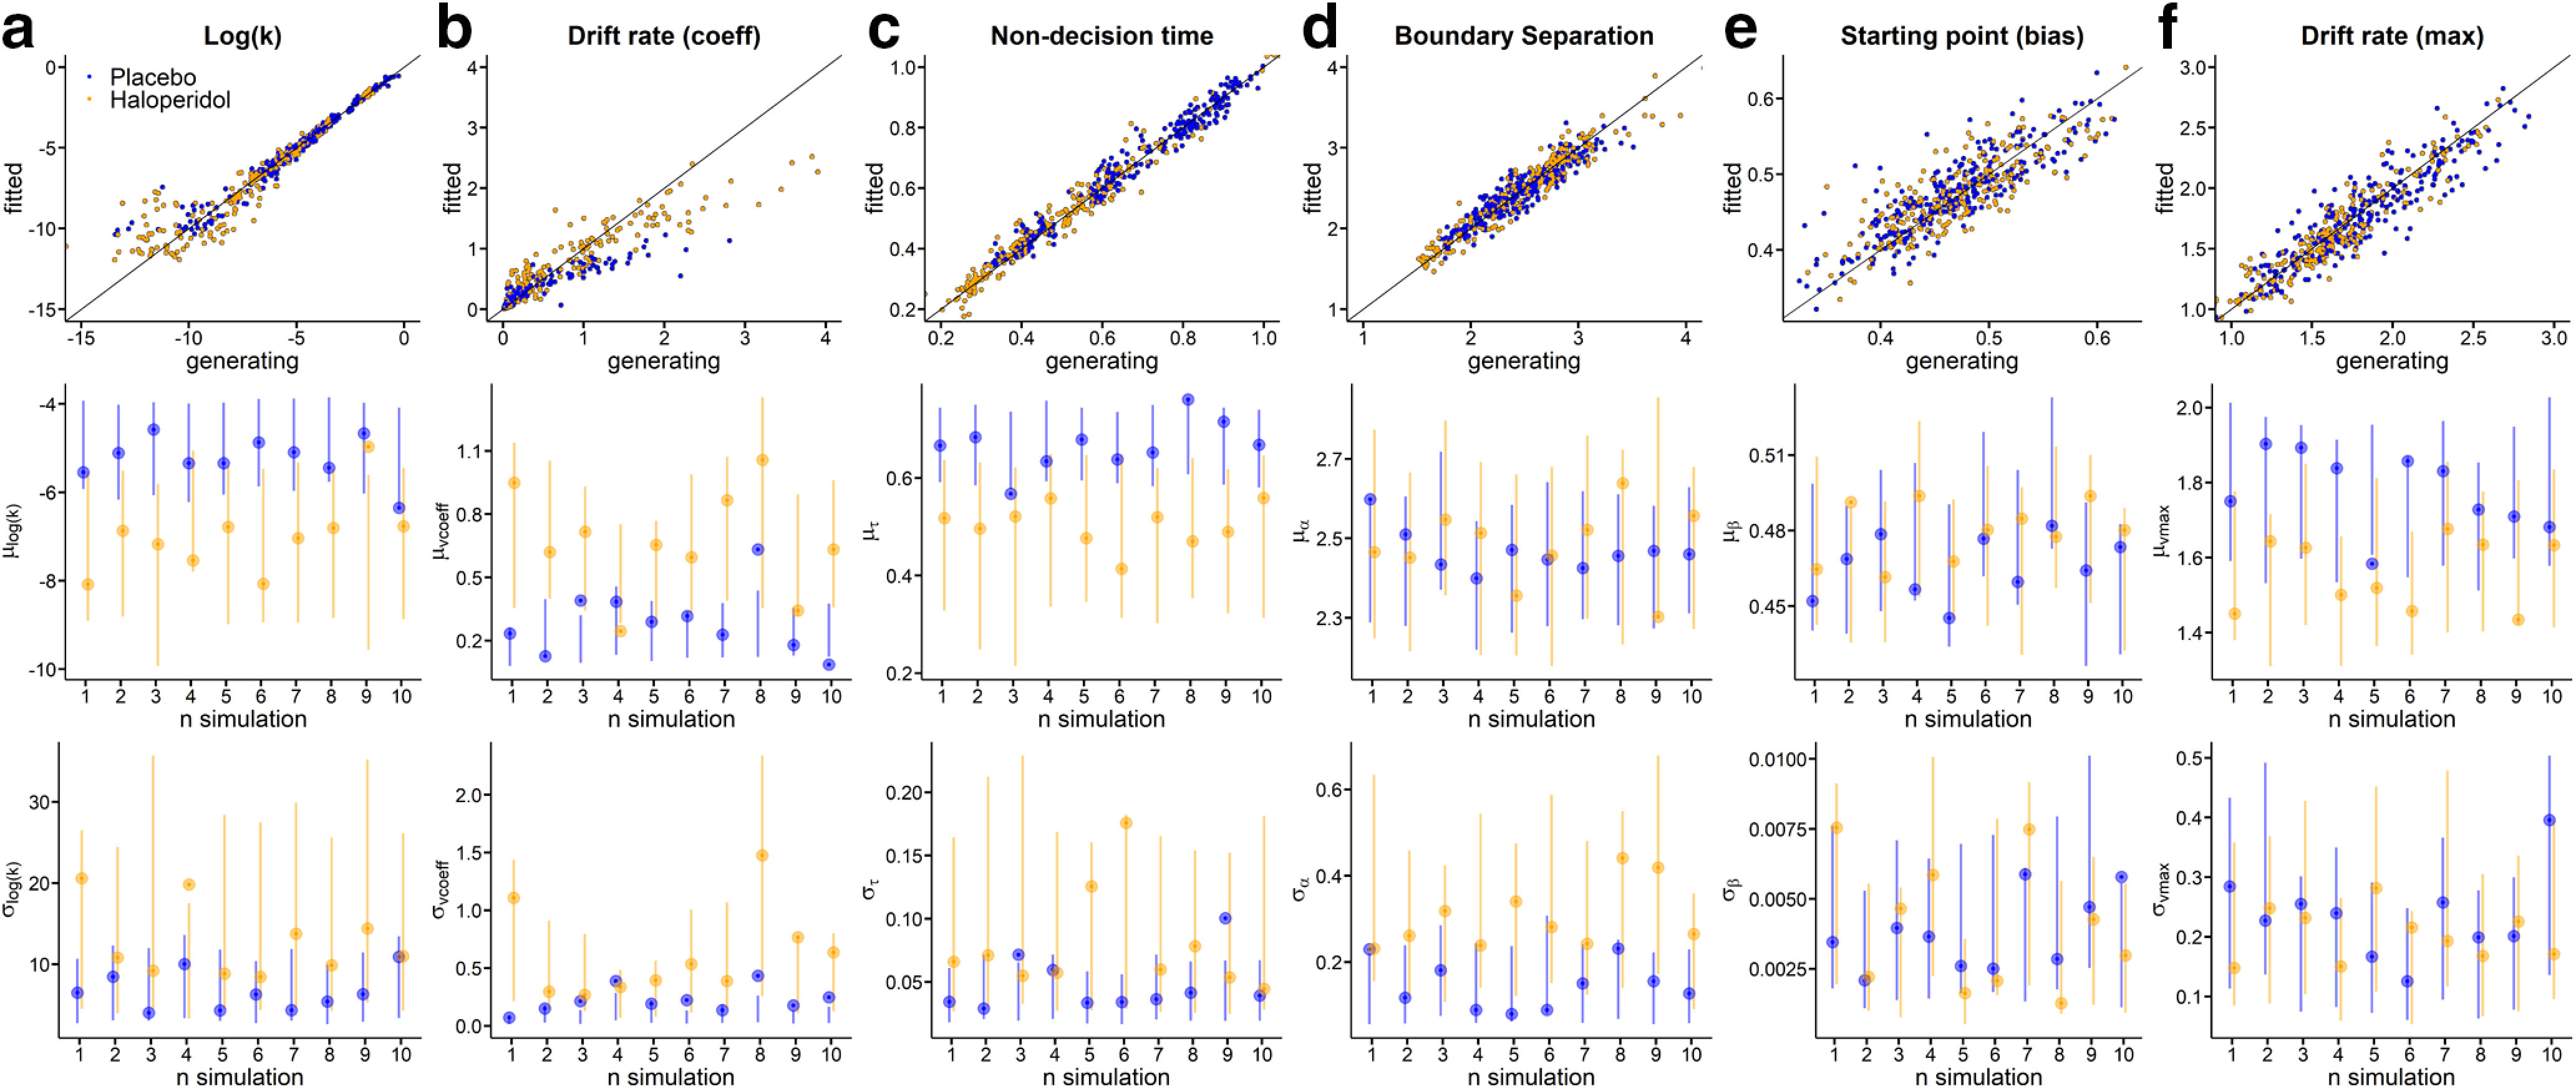
Figure 9.

Parameter recovery analysis for all Baseline parameters using the DDMs (a, Log(k); b, Drift rate coefficient; c, Nondecision time; d, Boundary separation; e, Starting point bias; f, Drift rate maximum). Top row: Generating parameters vs. fitted parameters for each subject across ten simulations for haloperidol group (yellow) and placebo group (blue). Second row: True generating group level hyperparameter means (points) and Bottom row: standard deviations (points) and estimated 95% highest density intervals (lines) per fitted simulation. For correlations between generating and estimated single-subject parameters, see Extended Data Figure 9-1.
