Figure 1.
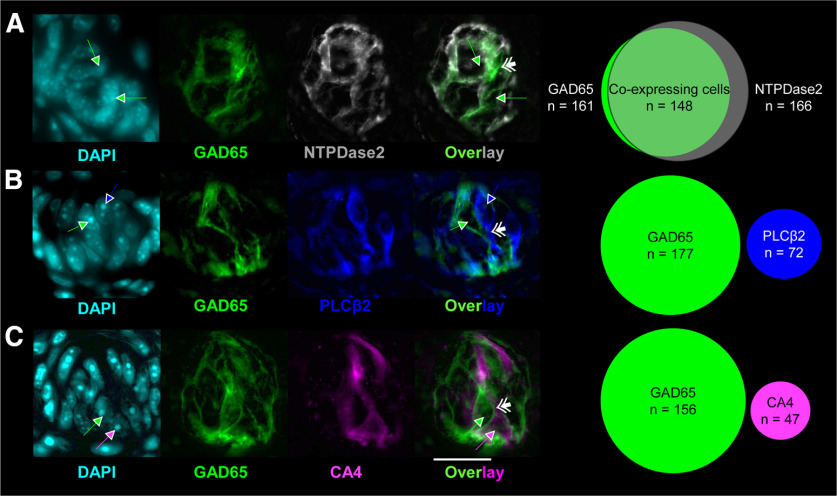
GAD65 is exclusively expressed in putative type I cells in fungiform papillae. A–C, Photomicrographs of native EYFP (green) expression in fungiform papillae immunohistochemically labeled for NTPDase2 (A; gray), PLCβ2 (B; blue), and CA4 (C; magenta). The relative degree of coexpression for each of the proteins is shown in Venn diagrams. DAPI is shown in cyan. Single arrows indicate the location of nuclei and are color coded to indicate whether it was associated with EYFP- (green), PLCβ2- (blue), or CA4- (magenta) expressing cells. Double arrows indicate taste cell membranes. A good example of the glial-like appearance of GAD65+ cells is shown in the EYFP-CA4 overlay. As shown in C (overlay) the CA4 cell is essentially “hugged” by two adjacent GAD65+ cells. All images were taken with a 100× oil-immersion microscope. Scale bar: (in C) A–C, 20 µm.

