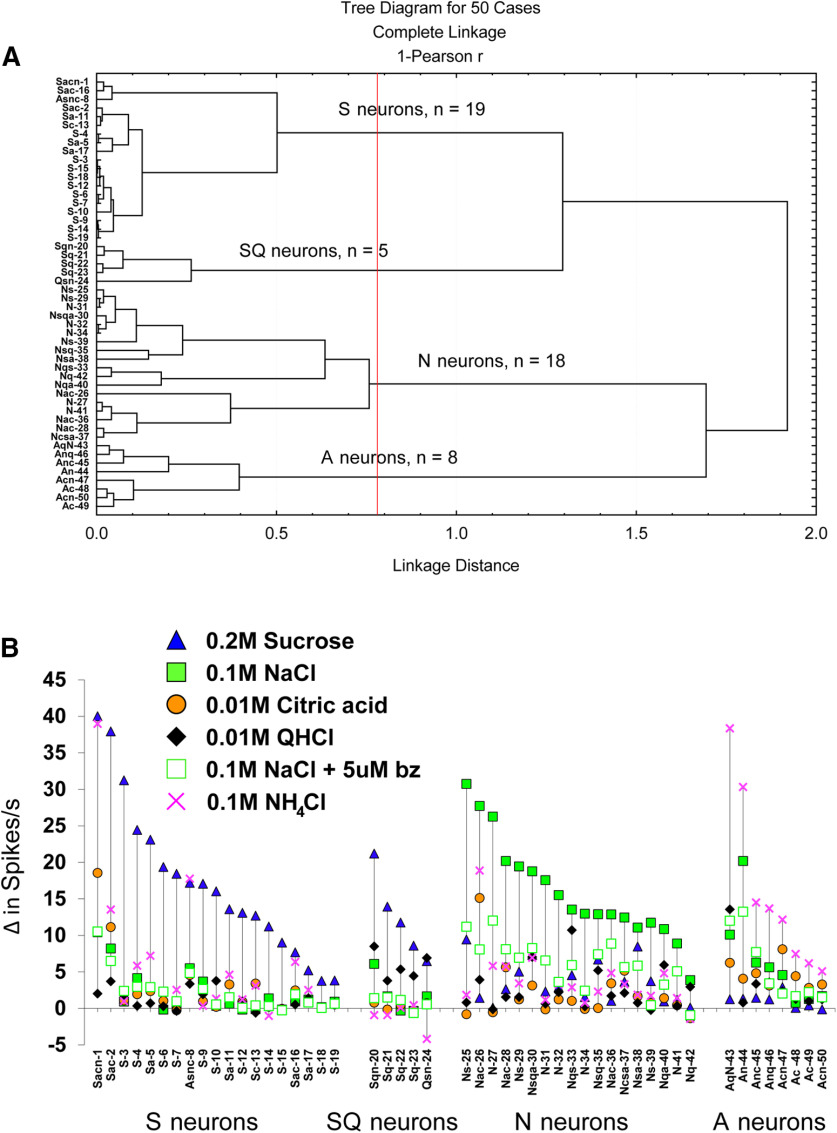
Figure 3.
Gustatory neurons grouped by stimulus response profile. A, Dendrogram showing the results of the hierarchical cluster analysis. Next to each neuron is the capital letter indicating the taste stimulus (S, 0.2 m sucrose; N, 0.1 m NaCl; C, 0.01 m citric acid; Q, 0.01 m QHCl; A, 0.1 m NH4Cl) that evoked the best response. Subsequent lower case letters are responses that were ≥25% of the best response. The vertical red line indicates where the scree plot showed an abrupt deflection, separating neurons into four groups. B, Response profiles of all 50 gustatory neurons grouped according to the cluster analysis and arranged within groups by the best response in descending order (left to right). On the figure, benzamil is abbreviated as “bz.” Note that for clarity the neuron number and letters indicating its response characteristics are shown in the dendrogram and graph.

