Figure 6.

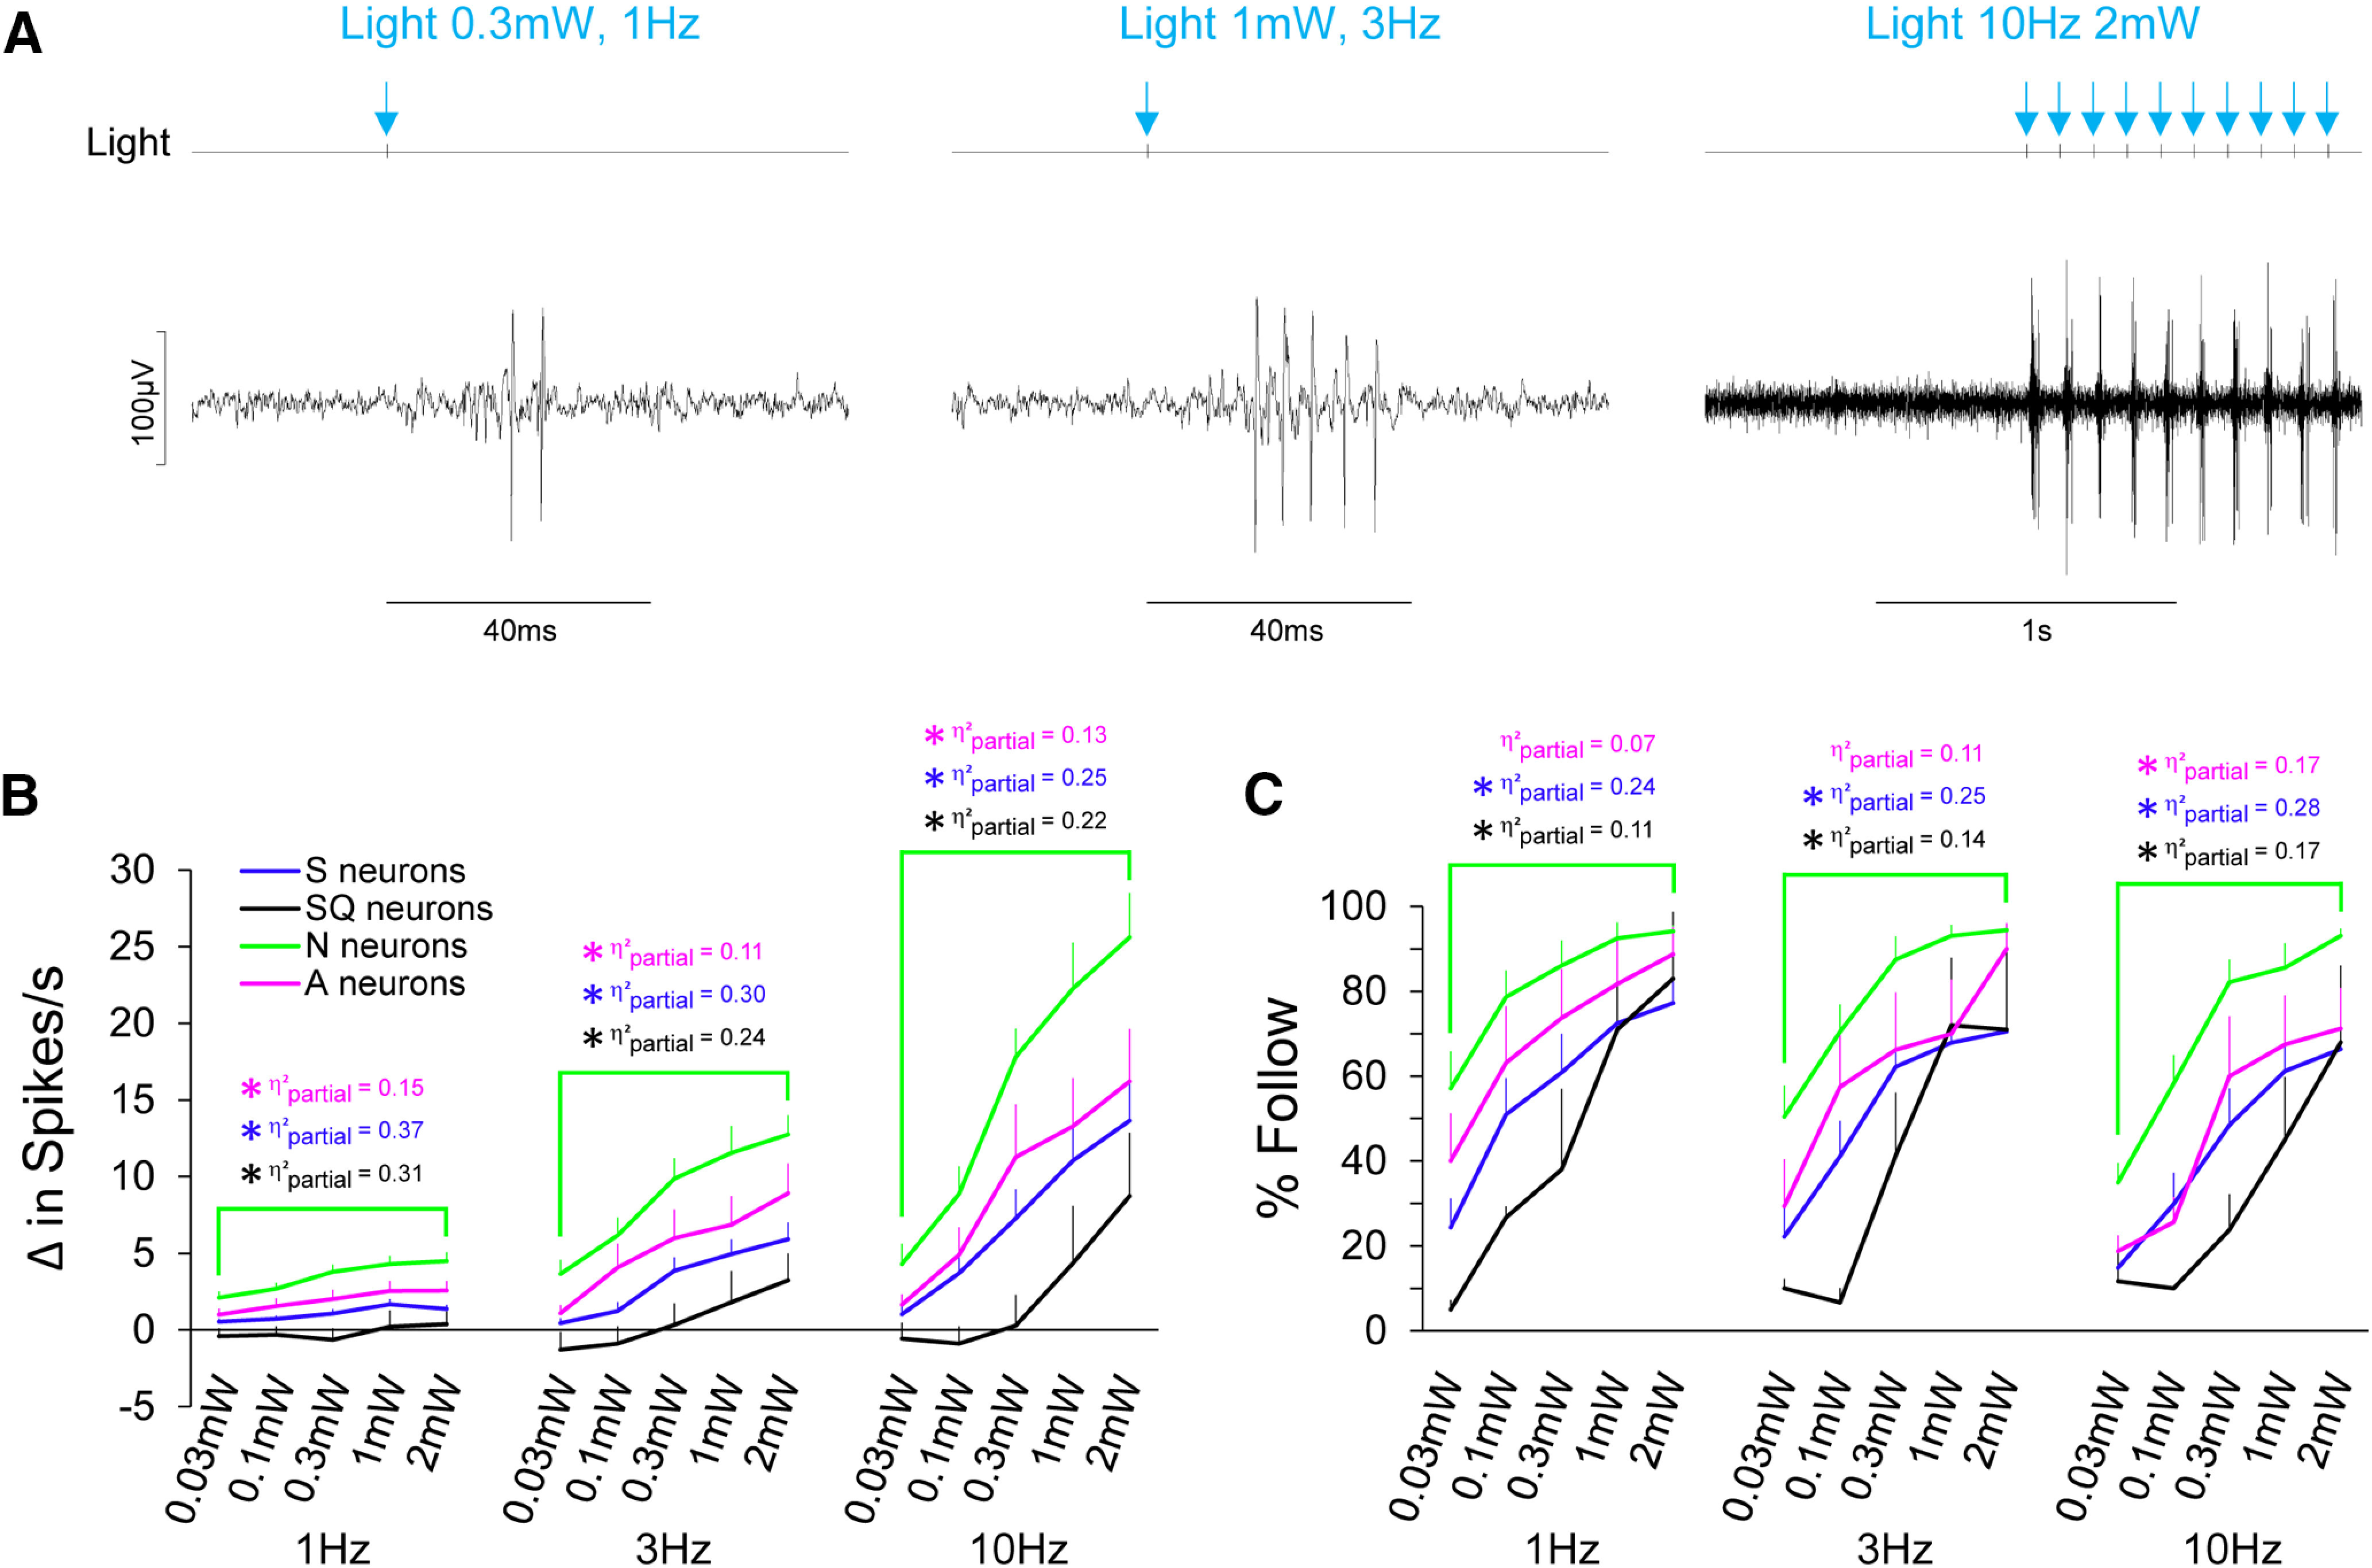
N neurons respond robustly and faithfully to light in a dose-dependent manner. A, Raw electrophysiological traces from an N neuron in response to light pulses at varying intensities and pulse frequencies. Light pulses, by way of TTL trigger are shown on the light channel and also by blue arrows for convenience. B, Average spike per second of gustatory neuron types to optogenetic stimulation of fungiform receptive fields to a range of intensities (0.03–2 mW) at 1, 3, and 10 Hz. C, The ability for gustatory neuron types to follow light pulses across the range of light intensity and pulse frequency are shown. Asterisks are color coordinated to reflect significant differences (following Benjamini–Hochberg adjustment) between neuron groups. The effect size (η2partial) of each statistical comparison is also color coordinated. Blue indicates comparisons between N and S neurons; black indicates comparisons between N and SQ neurons; magenta indicates comparisons between N and A neurons.
