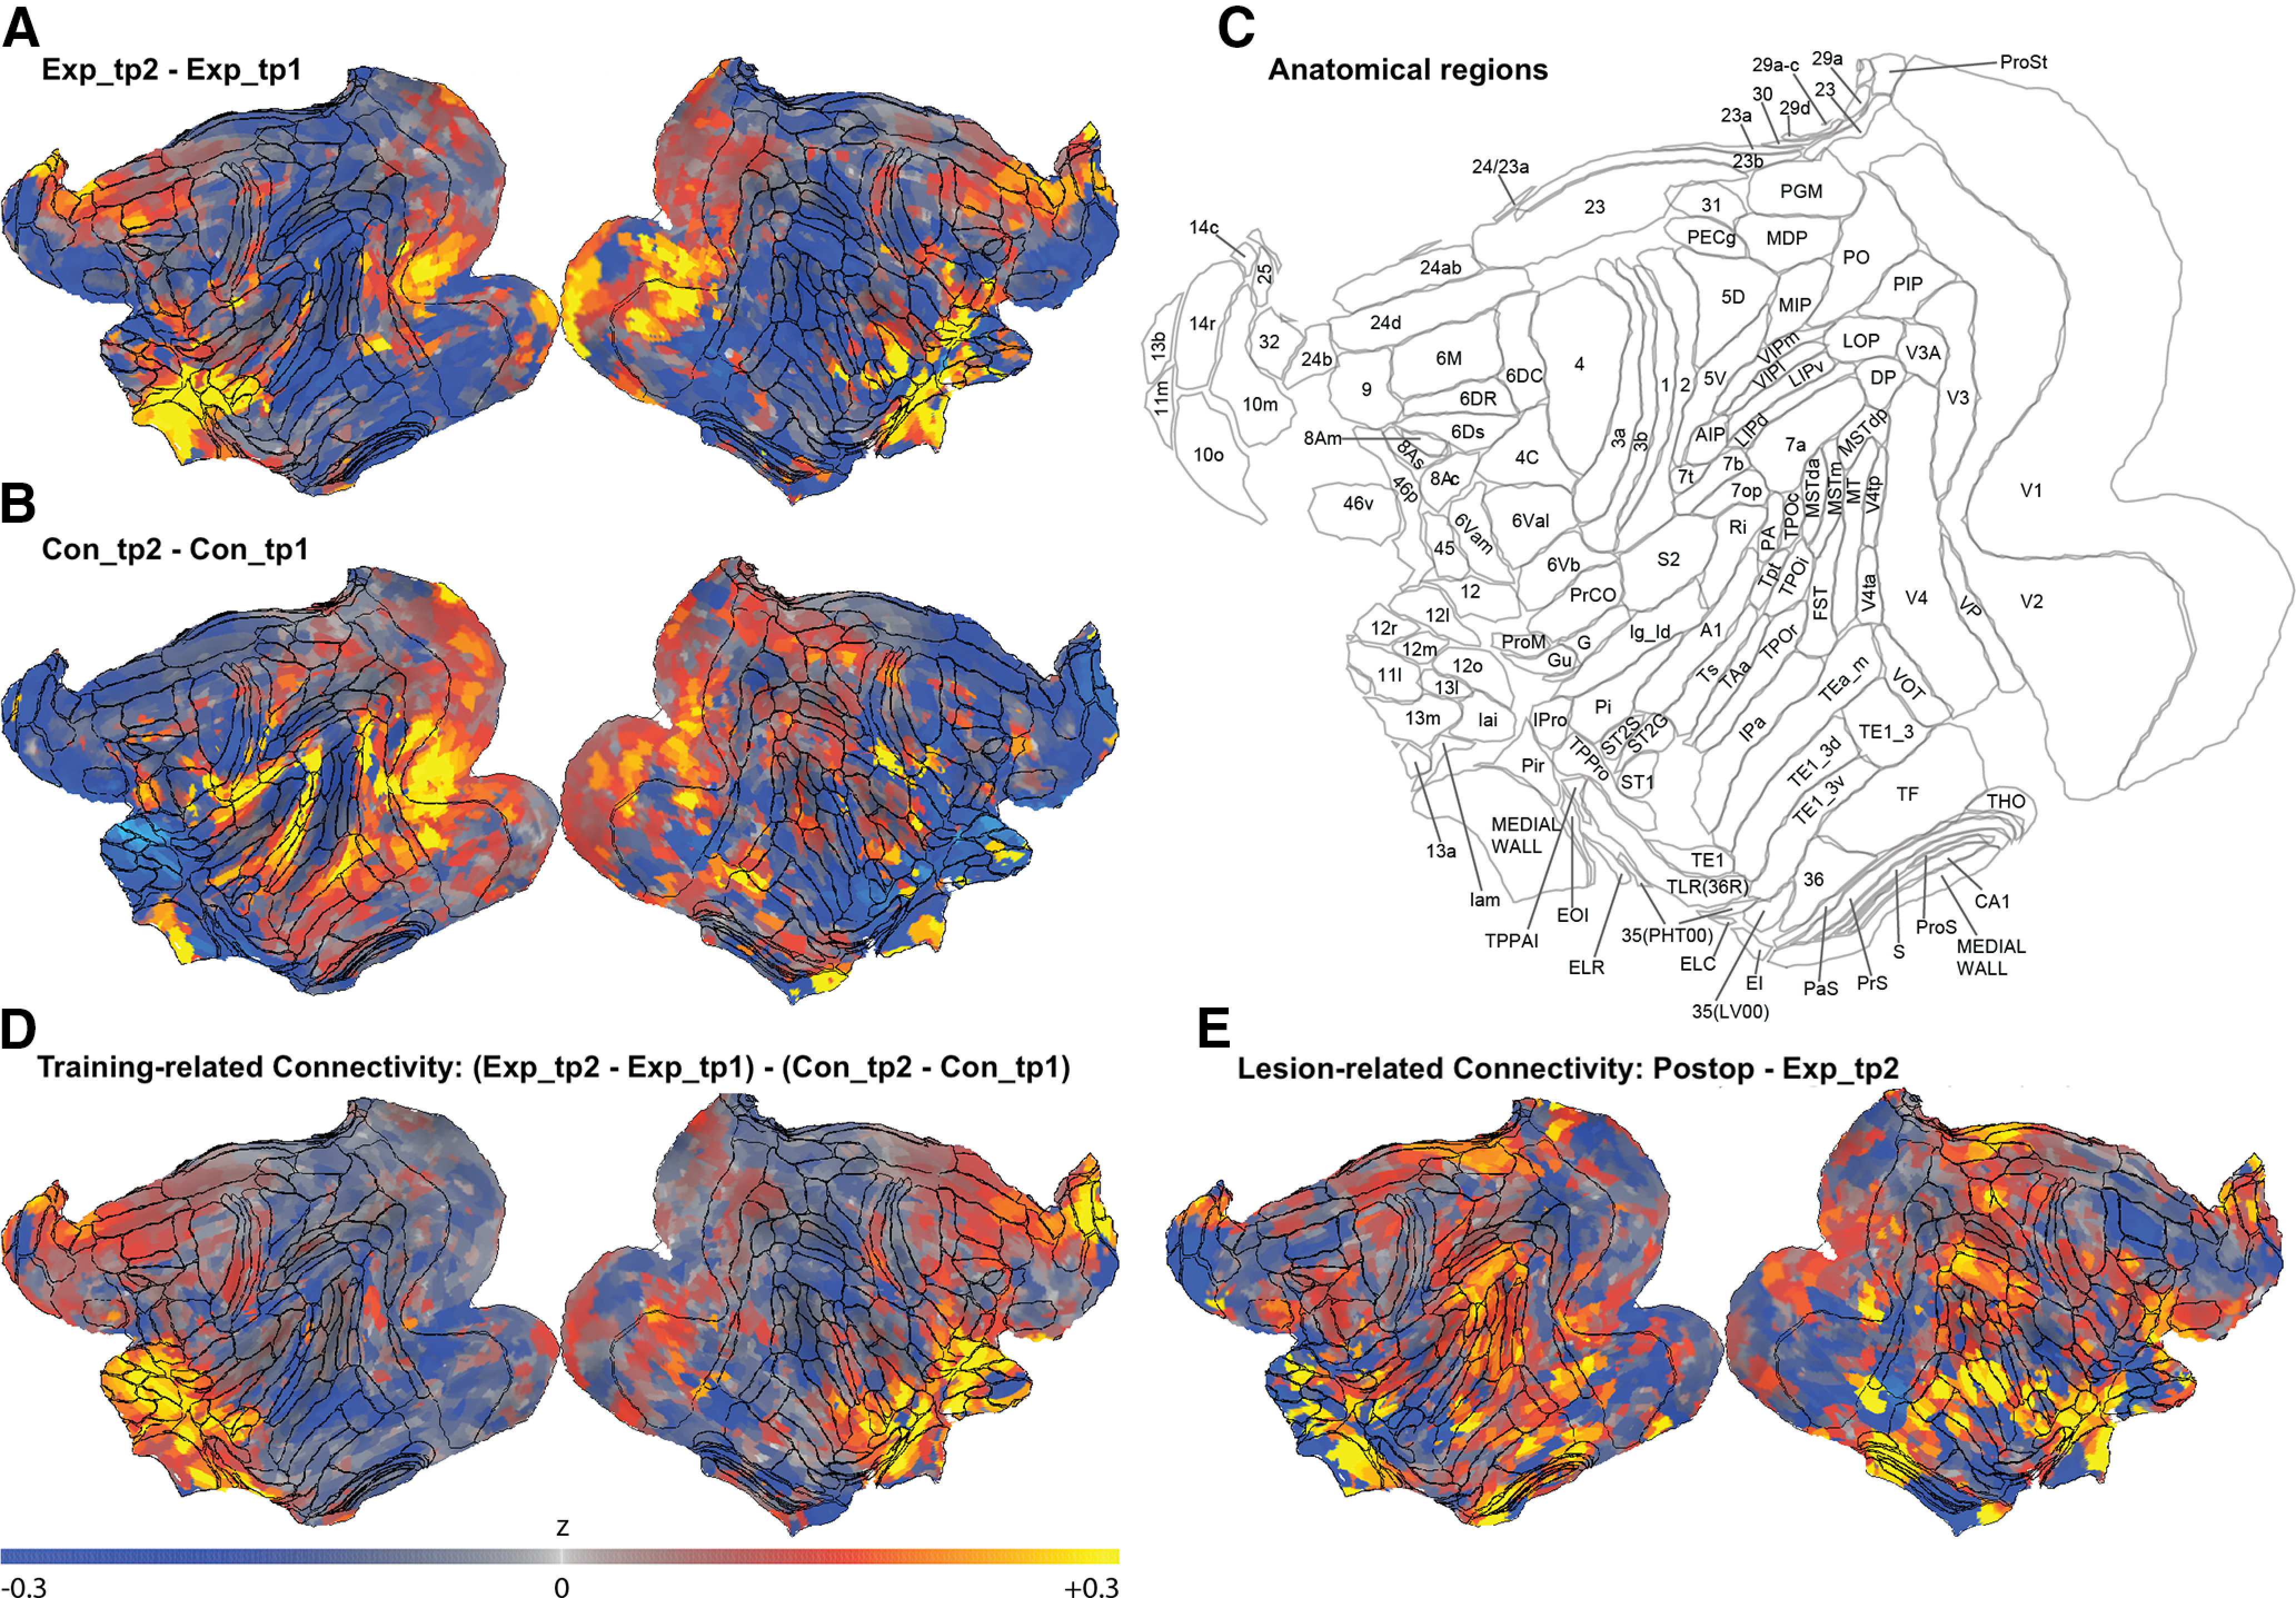
Figure 3.

Whole-brain seed-to-voxel connectivity maps for the right hemisphere 12o ROI as an example seed showing functional connectivity (defined as the rsfMRI time-series mean difference in correlations between our seed and all other voxels in the brain). Maps show changes in functional connectivity, that is, changes in correlation strength, between the two time points of the Experimental group (A) and the Control group (B). Increased mean correlations (values >0 in the color map) indicate increased connectivity in time point 2 compared with time point 1, whereas values <0 indicate decreased connectivity in time point 2. C, Anatomical regions from the LV-FOA-PHT composite cytoarchitectonic parcellation (Van Essen et al., 2012). D, Visuospatial training-related changes in functional connectivity, that is, changes in the Experimental group (Exp_tp2-Exp_tp1) compared with the Control group (Con_tp2-Con_tp1). E, Changes in functional connectivity after completing the postoperative performance test (Postop; the time point for the Experimental group scans after bilateral fornix transections), relative to Exp_tp2 (the time point scans before completing the preoperative performance test).
