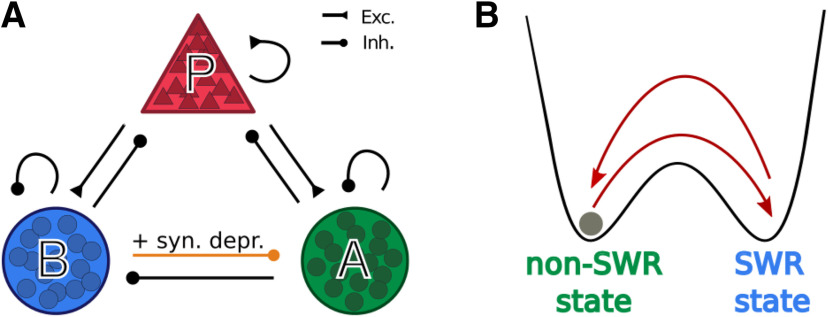
Figure 1.
Network structure. A, The network model comprises a population of pyramidal cells (P) and two groups of interneurons (PV+ BCs and anti-SWR cells, B and A, respectively). Arrows ending with a triangle indicate excitatory connections (Exc.). Arrows ending with a circle indicate inhibitory connections (Inh.). The connection from PV+ BCs to anti-SWR cells includes a short-term synaptic depression mechanism (syn. depr.). B, Schematic representation of network behavior through a particle (gray circle) moving in a potential landscape. The dynamics is characterized by the alternation between non-SWR and SWR states. Text color represents the dominant interneuron type in either state. External factors (current injection or dynamic synaptic depression) can be used to trigger transitions between the two states.

