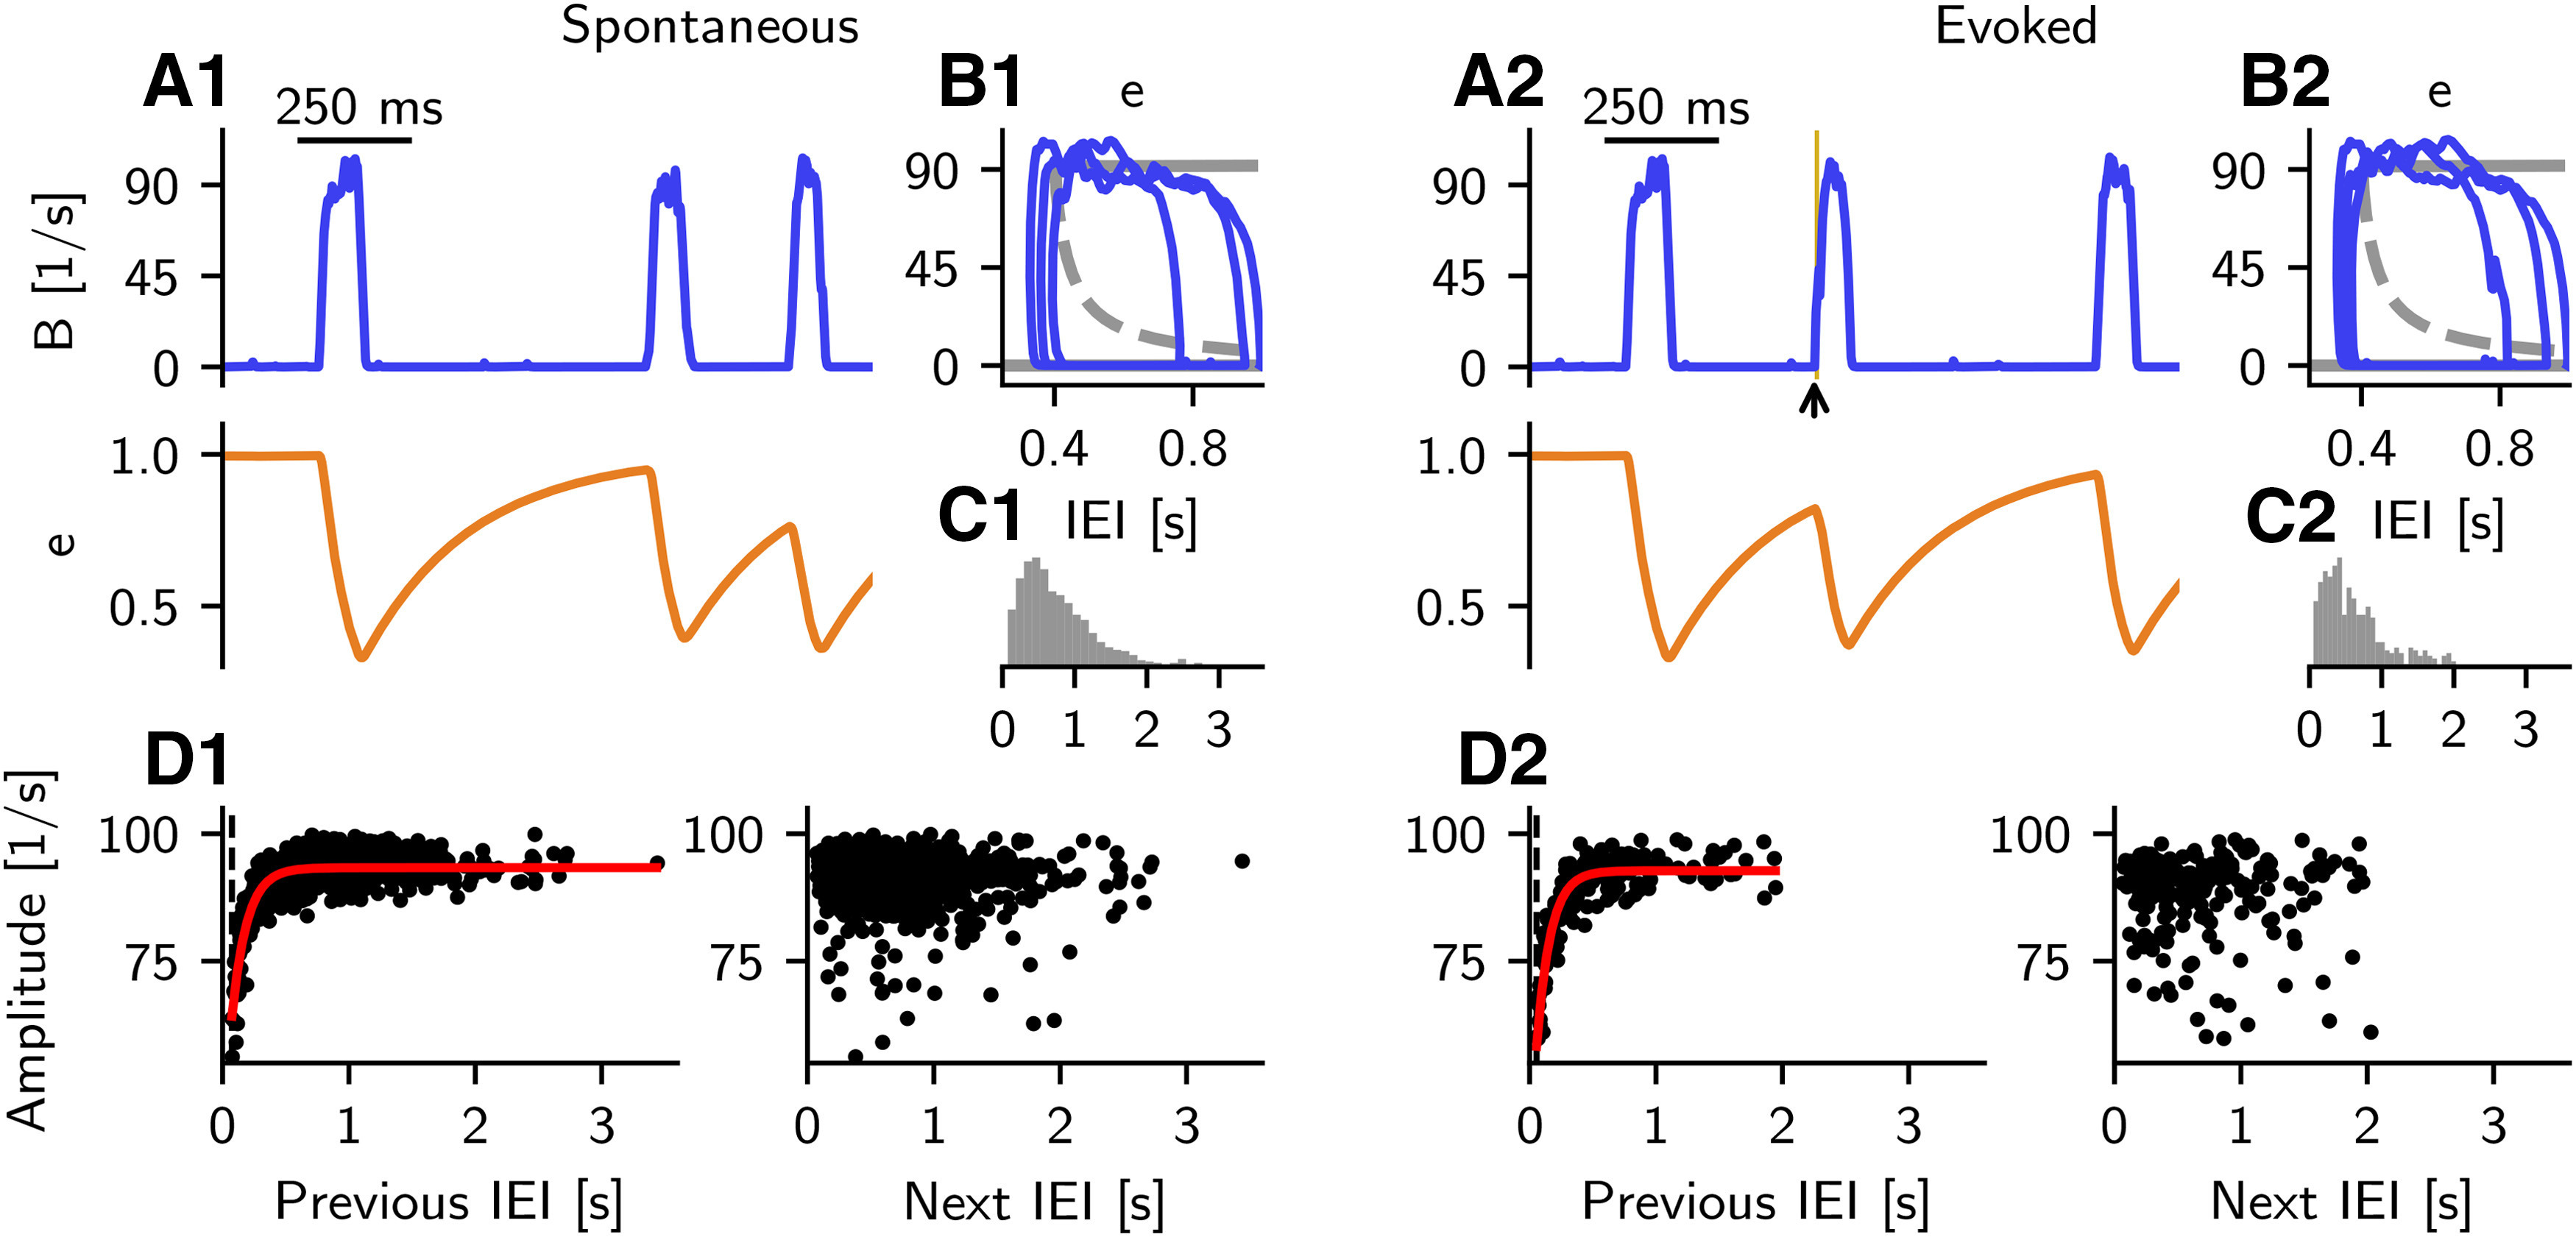
Figure 12.

Properties of spontaneous and evoked events in the rate model with noise. Noisy inputs mimicking synaptic current updates are injected to each rate-model population (see Materials and Methods). Left, Analysis of spontaneous events. Right, Analysis of evoked events. A1, B population rate (blue trace) and synaptic depression e (orange trace) displayed for 1.5 s of simulation. B1, B-e phase-plane view of trajectories shown in A1, overlain by the corresponding bifurcation diagram (gray). C1, Histogram of IEI (distance from end to start of events, calculated at half maximum) of spontaneous events. Events are calculated from the low-pass filtered (up to 10 Hz) B trace. D1, Amplitude (calculated from filtered signal) of each event with respect to the IEI. Left, Strong correlation between event amplitude and previous IEI. Each dot indicates a pair. Red line indicates the best fit exponential function (fitted time constant: 119 ms). Dashed line indicates the smallest observed IEI (74 ms). Right, Weak correlation between amplitude of event and length of the next IEI. A2, B2, C2, D2, Same as in A1, B1, C1, and D1, but for events evoked by additional step-current stimulation to B population (as in Fig. 10, currents are injected for a duration of 10 ms with amplitude IB = 150 pA; as in Fig. 11, currents are injected at intervals of ∼2 s; black arrow and yellow line in A2). D2, Dashed line indicates the smallest observed IEI (55 ms), and the best fit exponential function has a time constant of 110 ms.
