Figure 13.

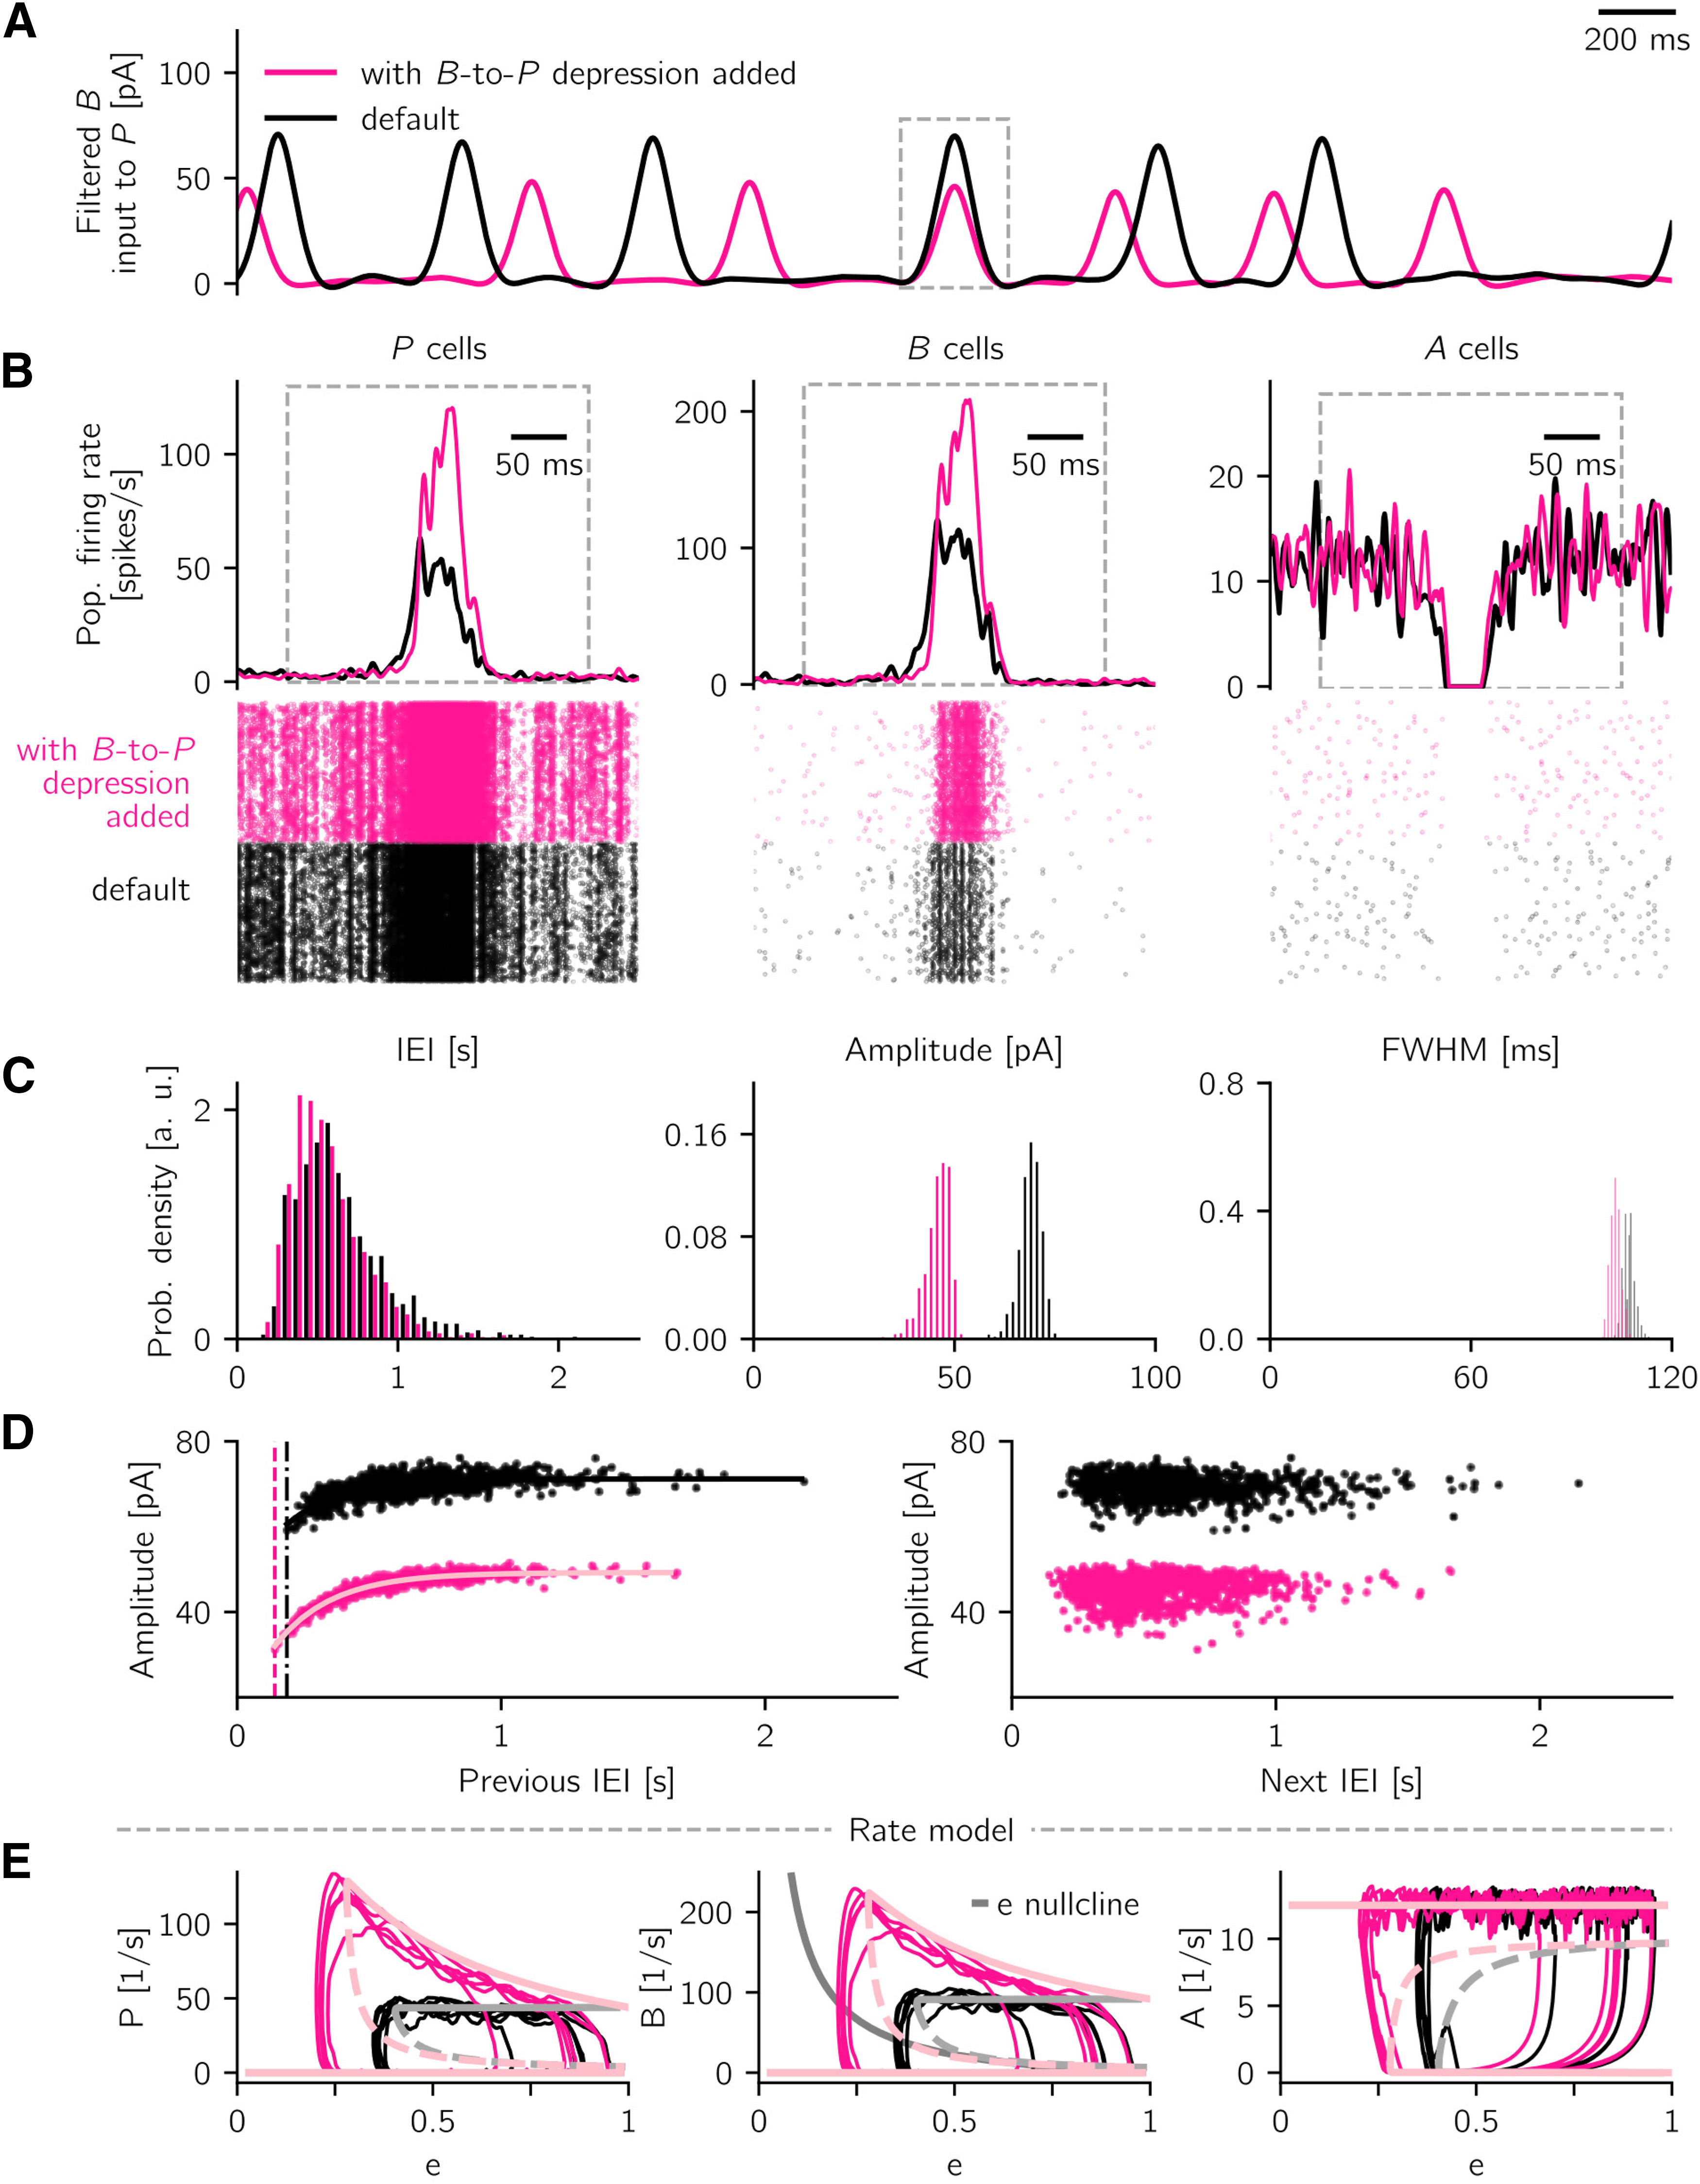
Effect of additional PV+ BC-to-pyramidal cell synaptic depression. A, Snapshot of spontaneous, low-pass (<5 Hz) filtered LFP activity in default setting (black, as Fig. 11) and in the scenario where synaptic depression is added (pink). B, One event is isolated, and the corresponding population firing rates and cells' raster plots are shown (for P, B, and A cells, respectively). Events are aligned with respect to the peak of the LFP signal. C, Properties of spontaneous SWR events are summarized in histograms (IEI; amplitude; FWHM), in default (black) and depression (pink) scenarios. D, Correlation structure of sharp wave amplitude and previous (left) and next (right) IEI are remarkably similar in the two scenarios. The shift along the vertical axis is caused by the decreased event amplitude in the case with depression. Dashed lines indicate the smallest observed IEI for the default case (188 ms, black) and the case with additional depression (142 ms, pink). Solid curves indicate best fit exponential functions (fitted time constants are τ = 203 ms in default case and τ = 214 ms in the case with added B-to-P depression). Parameters used to simulate the spiking network are listed in Tables 1–3 and in Short-term plasticity. E, Rate-model bifurcation diagrams show the steady-state rates of P, B, and A as a function of the synaptic efficacy e in default scenario (light gray) and with additional depression (light pink). Solid (dashed) light pink and light gray curves indicate stable (unstable) fixed points. Middle, Solid dark gray curve indicates the e-nullcline, given by the last line in Equation 5. This synaptic depression mechanism causes e to increase in the non-SWR state, which allows fluctuations to start a SWR event, and causes e to decrease in the SWR state, which terminates the SWR event. Overlain are traces of a 3 s simulation of the rate model with noise (see Rate-model noise) for default case (black) and with additional depression (pink). During a SWR, the additional depression leads to increasing P and B activity while e is decreasing (curved shape of the SWR state in the left and middle panels). Network parameters are summarized in Table 5.
