Figure 3.
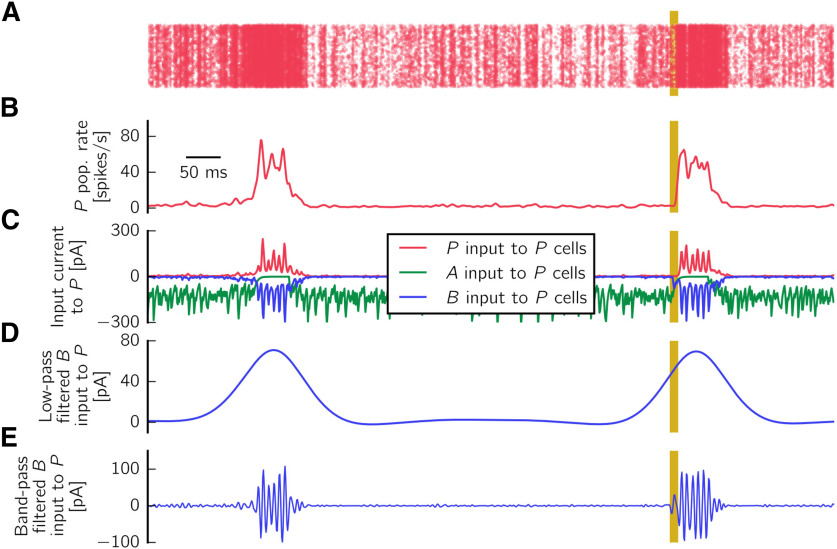
Definition of approximated LFP. A, Raster plot showing the population rate (pop. rate) of P cells during a spontaneous and an evoked SWR event. Yellow bars represent the interval of length 10 ms during which current is injected to B cells. B, Average population firing rate of P cells. C, Input current from P (red), B (blue), and A (green) cells impinging onto pyramidal cells, averaged across all neurons. The averaged input current from B to P cells is sign-reversed and used as an approximation of the LFP. D, LFP signal shown is low-pass filtered up to 5 Hz to extract the sharp wave component. E, LFP is bandpass filtered in the 90-180 Hz range to extract the ripple component.

