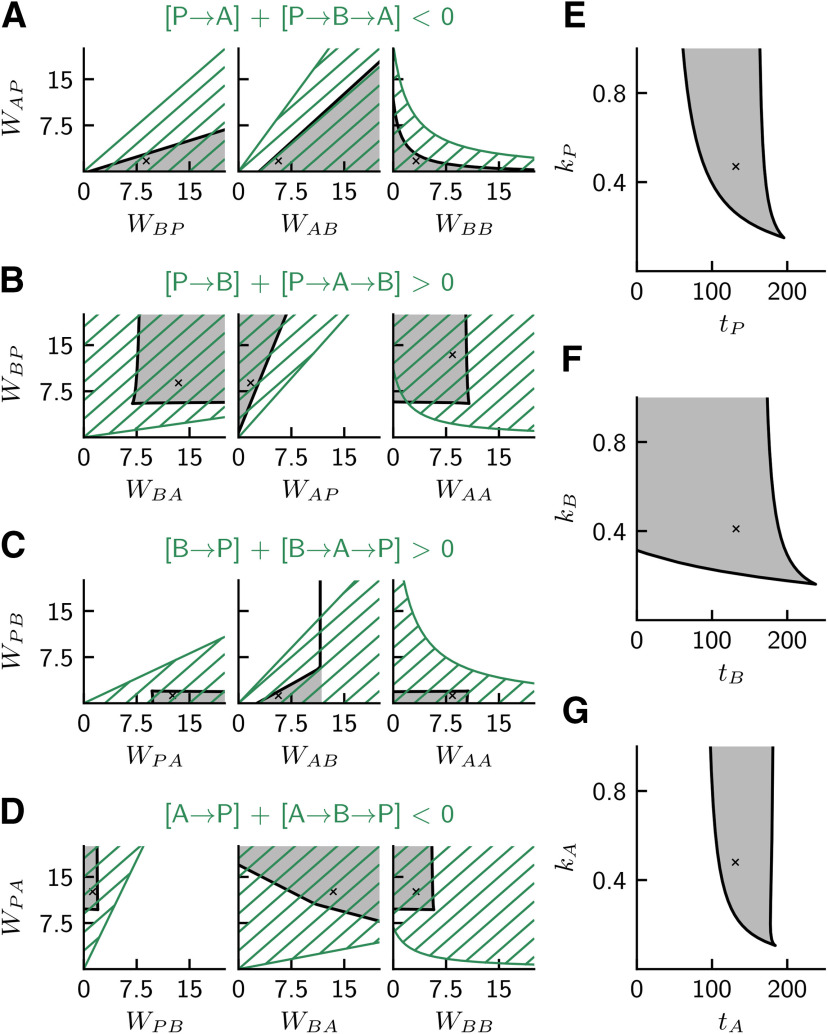
Figure 8.
Bistable regions in two-dimensional slices of parameter space. Each plot represents the network behavior with respect to a pair of parameters of the rate model. Black lines indicate a numerical continuation of the bifurcation point separating the bistable and monostable regions along two model parameters. Dark gray areas represent the bistable region where both SWR and non-SWR states coexist. Black crosses represent the standard chosen parameter values for the rate model (summarized in Table 5). A-D, Bistability with respect to connection strengths WIJ (in units pA · s) that contribute to the four pathway-strength requirements. For comparison, the hatched green areas represent the region where the requirements are met in their linear approximation (see Pathway strengths and quantification of requirements). E-G, Bistability with respect to slopes kI (in units 1/pA) and thresholds tI (in units pA) of the softplus activation functions (Eq. 6) for P, B, and A.

