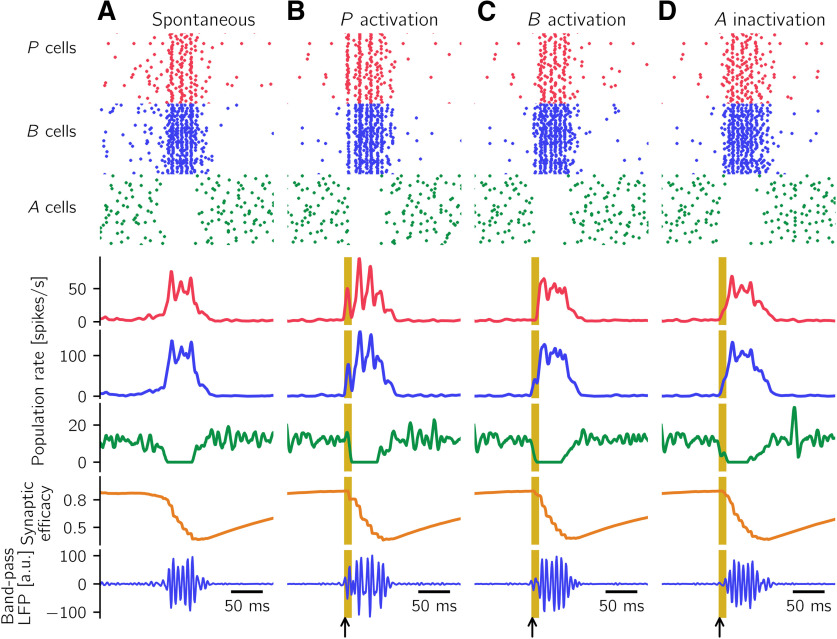
Figure 9.
SWR events can be generated in the spiking network. Each column describes one simulation. A, Spontaneous SWR events can be generated in the network. Displayed are raster plots for 50 cells of the P, B, and A populations (red, blue, and green, respectively; each row is one neuron), averaged population firing rates, the time course of the synaptic depression mechanism, and the bandpass filtered (90-180 Hz) component of the LFP signal (see Materials and Methods and Fig. 3). B, C, A fraction of all P and B cells are stimulated with depolarizing current for 10 ms (yellow areas, black arrows). The stimulation elicits SWR events comparable with the spontaneous ones, in agreement with experimental results. D, A fraction of A cells is stimulated with hyperpolarizing current for 10 ms. The stimulation elicits SWR events comparable with the spontaneous ones; this is a prediction of the model. Parameters used to simulate the spiking network are listed in Tables 1–3.

