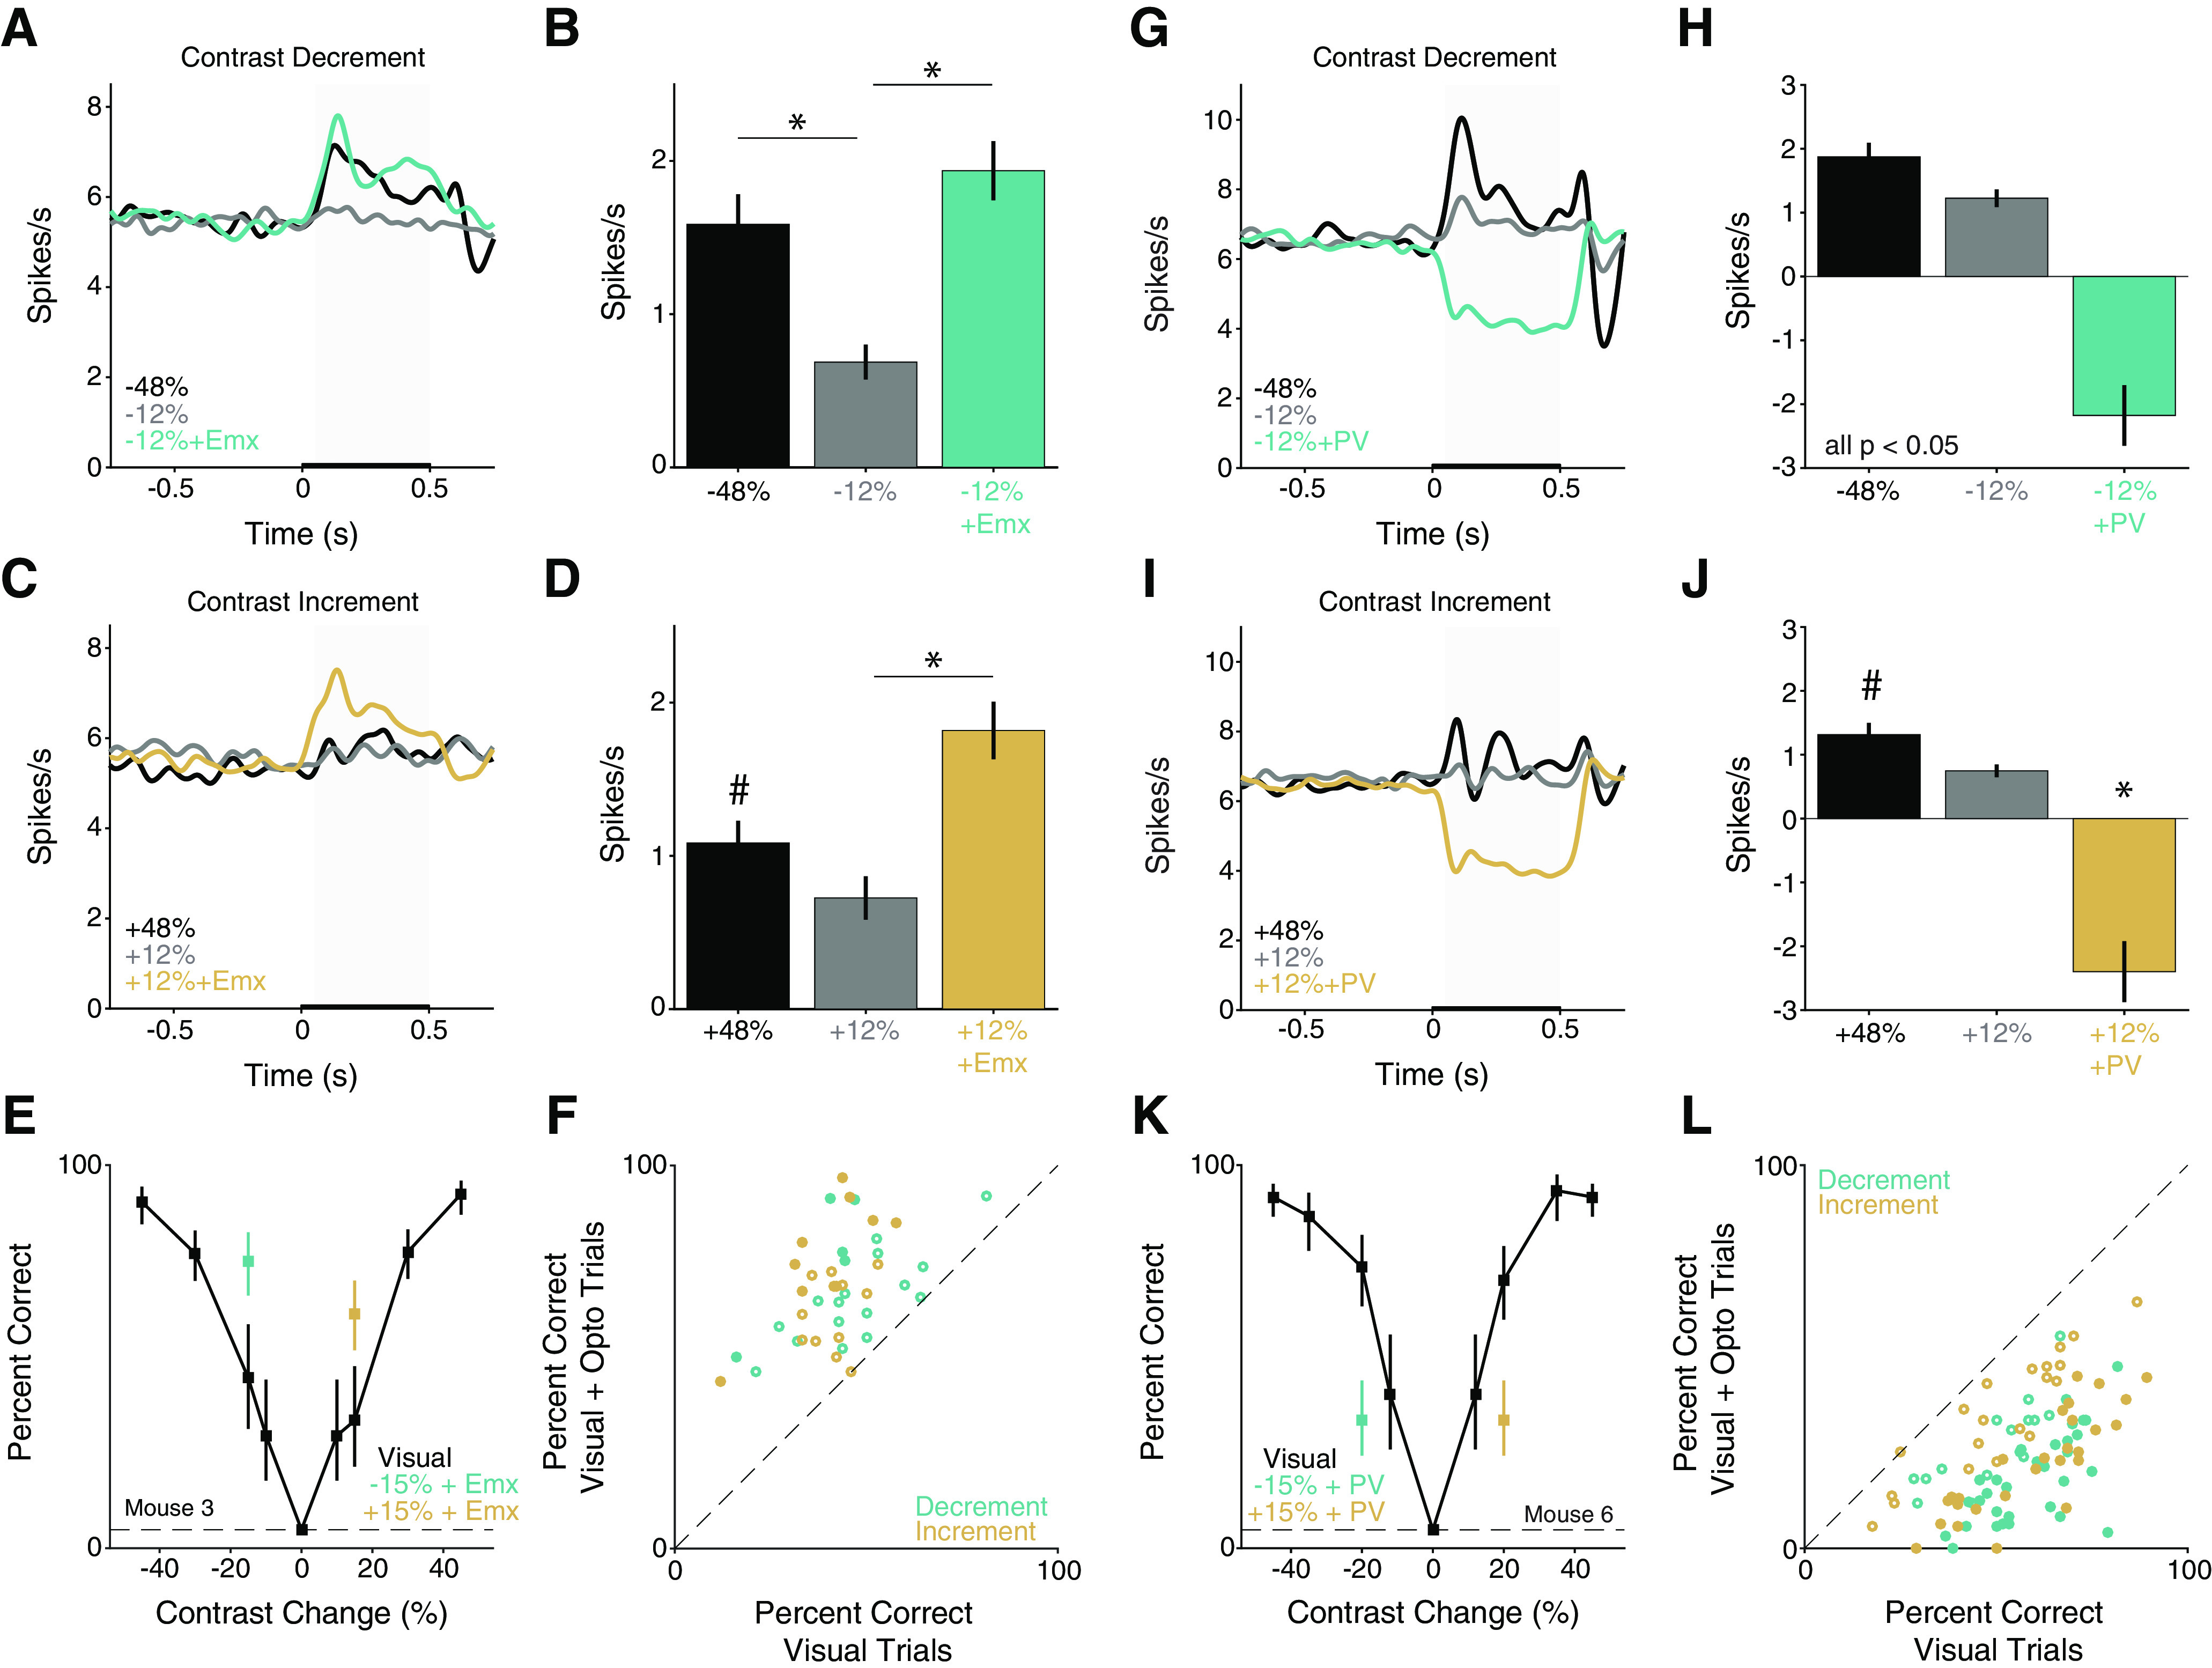
Figure 3.

Optogenetic stimulation of principal versus PV neurons produces opposing effects on V1 population responses and contrast change detection. A, Population Gaussian-filtered (σ = 25 ms) PSTH in response to large (black) and moderate decreases in contrast without (gray) or with (aqua) optogenetic stimulation of pyramidal neurons in passively viewing Emx mice (n = 119 units). Thickening of the x axis represents duration of visual and optogenetic stimuli. Gray box represents analysis window (50-500 ms) used for spike rate quantification in B. B, Average change in spike rate (± SEM) compared with the time-matched baseline period. *p < 0.0001, relative to −12% change (Friedman's test with Dunn–Sidak correction). C, Same as in A, but for contrast increments. D, Quantification of spike rate changes evoked by contrast increments with and without optogenetic stimulation. #p < 0.10, 48% compared with both 12% contrast change without (gray) and with (gold) optogenetic stimulation. *p < 0.0001, 12% change with versus without optogenetic stimulation (Friedman's test with Dunn–Sidak correction). E, Representative behavioral performance from a single session in an Emx mouse. Points and lines represent the percent correct ± 67% CI for trials without (black) optogenetic stimulation or decreases (aqua) and increases in contrast (gold) paired with optogenetic of excitatory neurons. Dashed line indicates false alarm rate. F, Summary of stimulation effects in Emx mice. Circles represent the percent correct in individual behavioral sessions (3 mice, 21 sessions) with (y axis) and without (x axis) optogenetic stimulation, separately for increases (gold) and decreases (aqua) in contrast. Filled circles represent significant change in detection performance (14 of 42 observations, p < 0.05, Fisher's exact test). G, Same as in A, but for decreases in contrast presented with and without optogenetic stimulation of PV interneurons in PV mice (n = 131 units). H, Average change in spike rate with and without stimulation of PV interneurons compared with the time-matched baseline period (all comparisons at least p < 0.05; Friedman's test with Dunn–Sidak correction). I, Same as in G, but for contrast increments with and without stimulation of PV interneurons. J, Average change in spike rate evoked by contrast increments with and without optogenetic stimulation of PV interneurons. #p < 0.10, 48% compared with 12% contrast change without (gray) optogenetic stimulation. *p < 10−8, 12% change with optogenetic stimulation (gold) compared with large (48%) and moderate (12%) contrast increments. K, Same as in E, but for a single session in a PV mouse. L, Summary of stimulation effects in PV mice (6 mice, 47 sessions). Conventions are the same as in F. Filled circles represent significant change in detection performance (57 of 92 observations, both increases and decreases; p < 0.05, Fisher's exact test).
