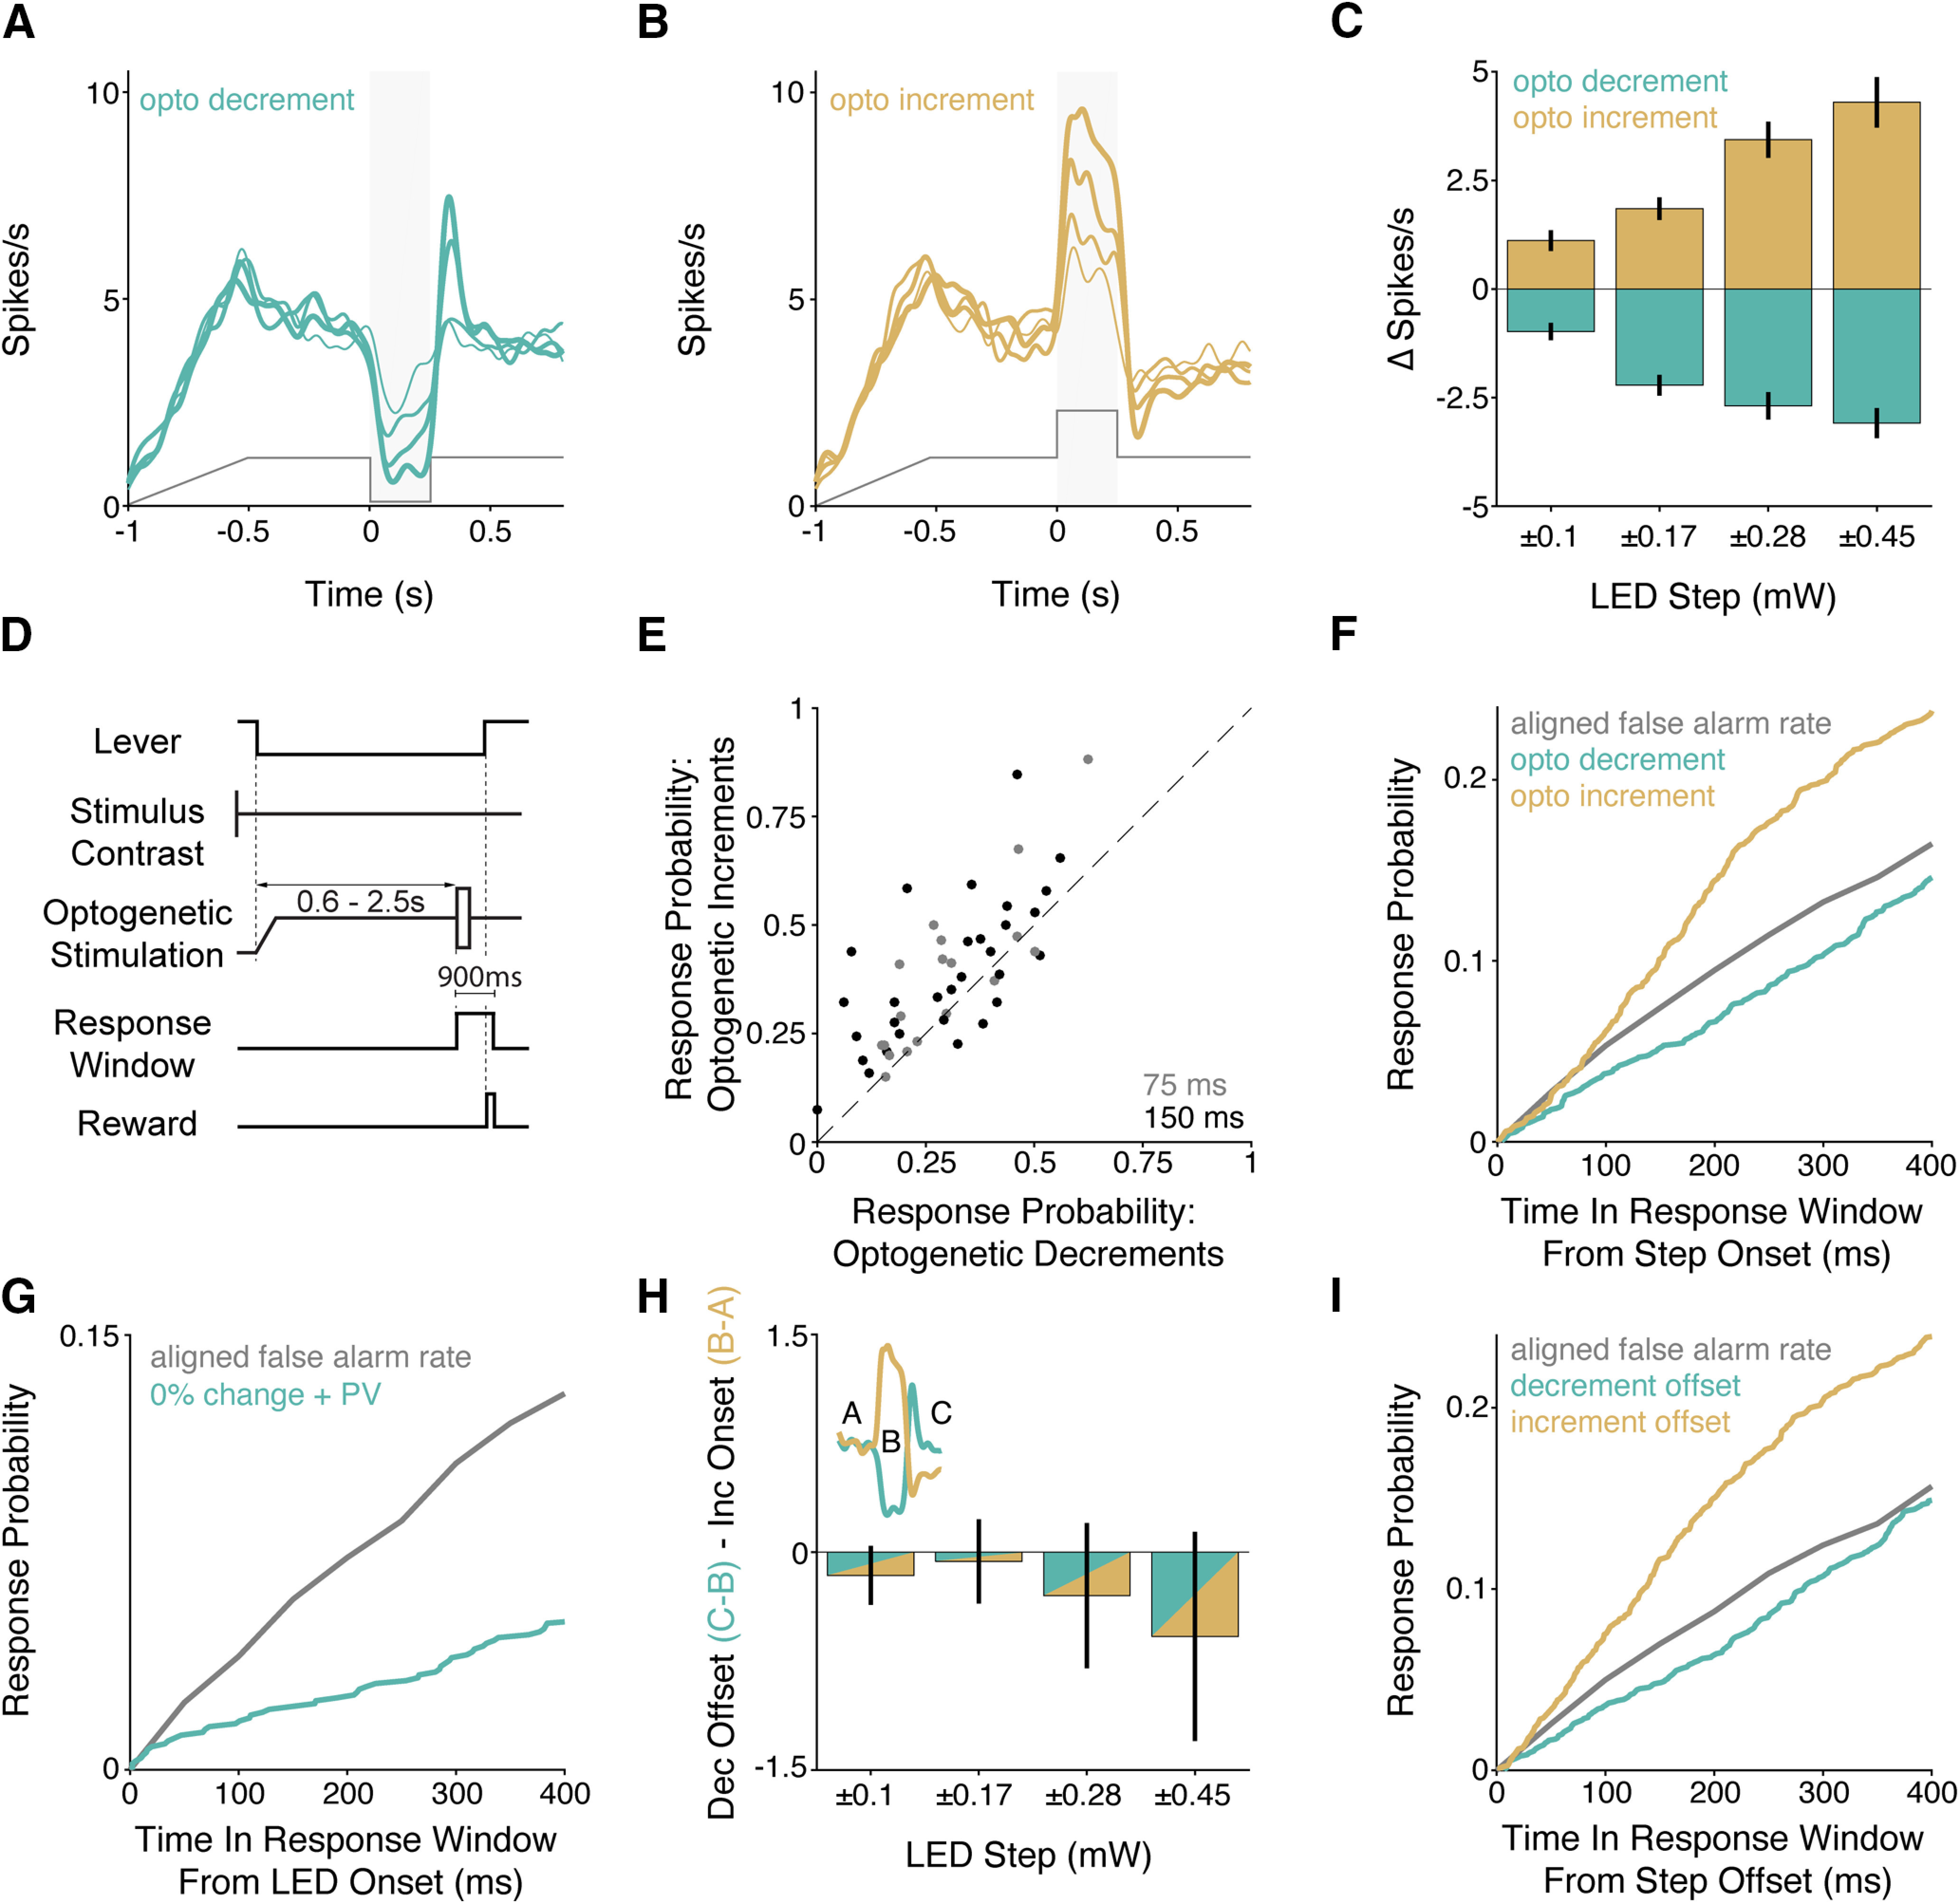
Figure 5.

Optogenetically incrementing or decrementing excitatory input into the V1 population asymmetrically affects the probability of behavioral responses. A–C, Electrophysiological recordings confirm V1 spiking follows complex optogenetic input. A, Average PSTHs for optogenetically responsive units (n = 31 units) in response to different magnitude decrements in optogenetic input. Increasing line thickness corresponds to the magnitude of optogenetic decrement (step sizes listed in C). Gray trace represents the profile of optogenetic stimulation. B, Same as in A, but for increments in optogenetic input. C, Quantification of V1 spike rate changes in response to decrements (aqua) and increments (gold) in optogenetic input (Mean ± SEM). The magnitude of spike rate change significantly depends on the step size (increments and decrements, both p < 10−4; Kruskal–Wallis test). D, Trial schematic. The visual contrast was fixed at 50%. At trial onset, the LED power ramped up and then held at a fixed value. After the random delay, the LED power briefly (75 or 150 ms) stepped up or down. E, Scatter plot depicts % correct for trials with optogenetic decrements (x axis) and increments (y axis) measured in the same session (n = 3 mice; 50 sessions). Gray points represent 75 ms optogenetic step duration (Mean ± SEM). Black represents 150 ms optogenetic step duration. F, Time course of changes in the lever release probability following optogenetic decrements (aqua) or increments (gold) compared with a time-in-trial matched false alarm rate (gray). G, Same as in F, but for optogenetic stimulation of PV interneurons (aqua; n = 4 mice; 38 sessions) on trials without contrast changes compared with a time-in-trial matched false alarm rate (gray). H, Quantification of differences between V1 spike rate changes induced by the offset of optogenetic decrements (aqua) versus the onset of increments (gold) across the different optogenetic step sizes. Inset, Epochs of spiking being compared. Error bars indicate SEM. Dec, decrement; Inc, increment. I, Same as in F, but behavioral responses were aligned to the end of the optogenetic steps.
