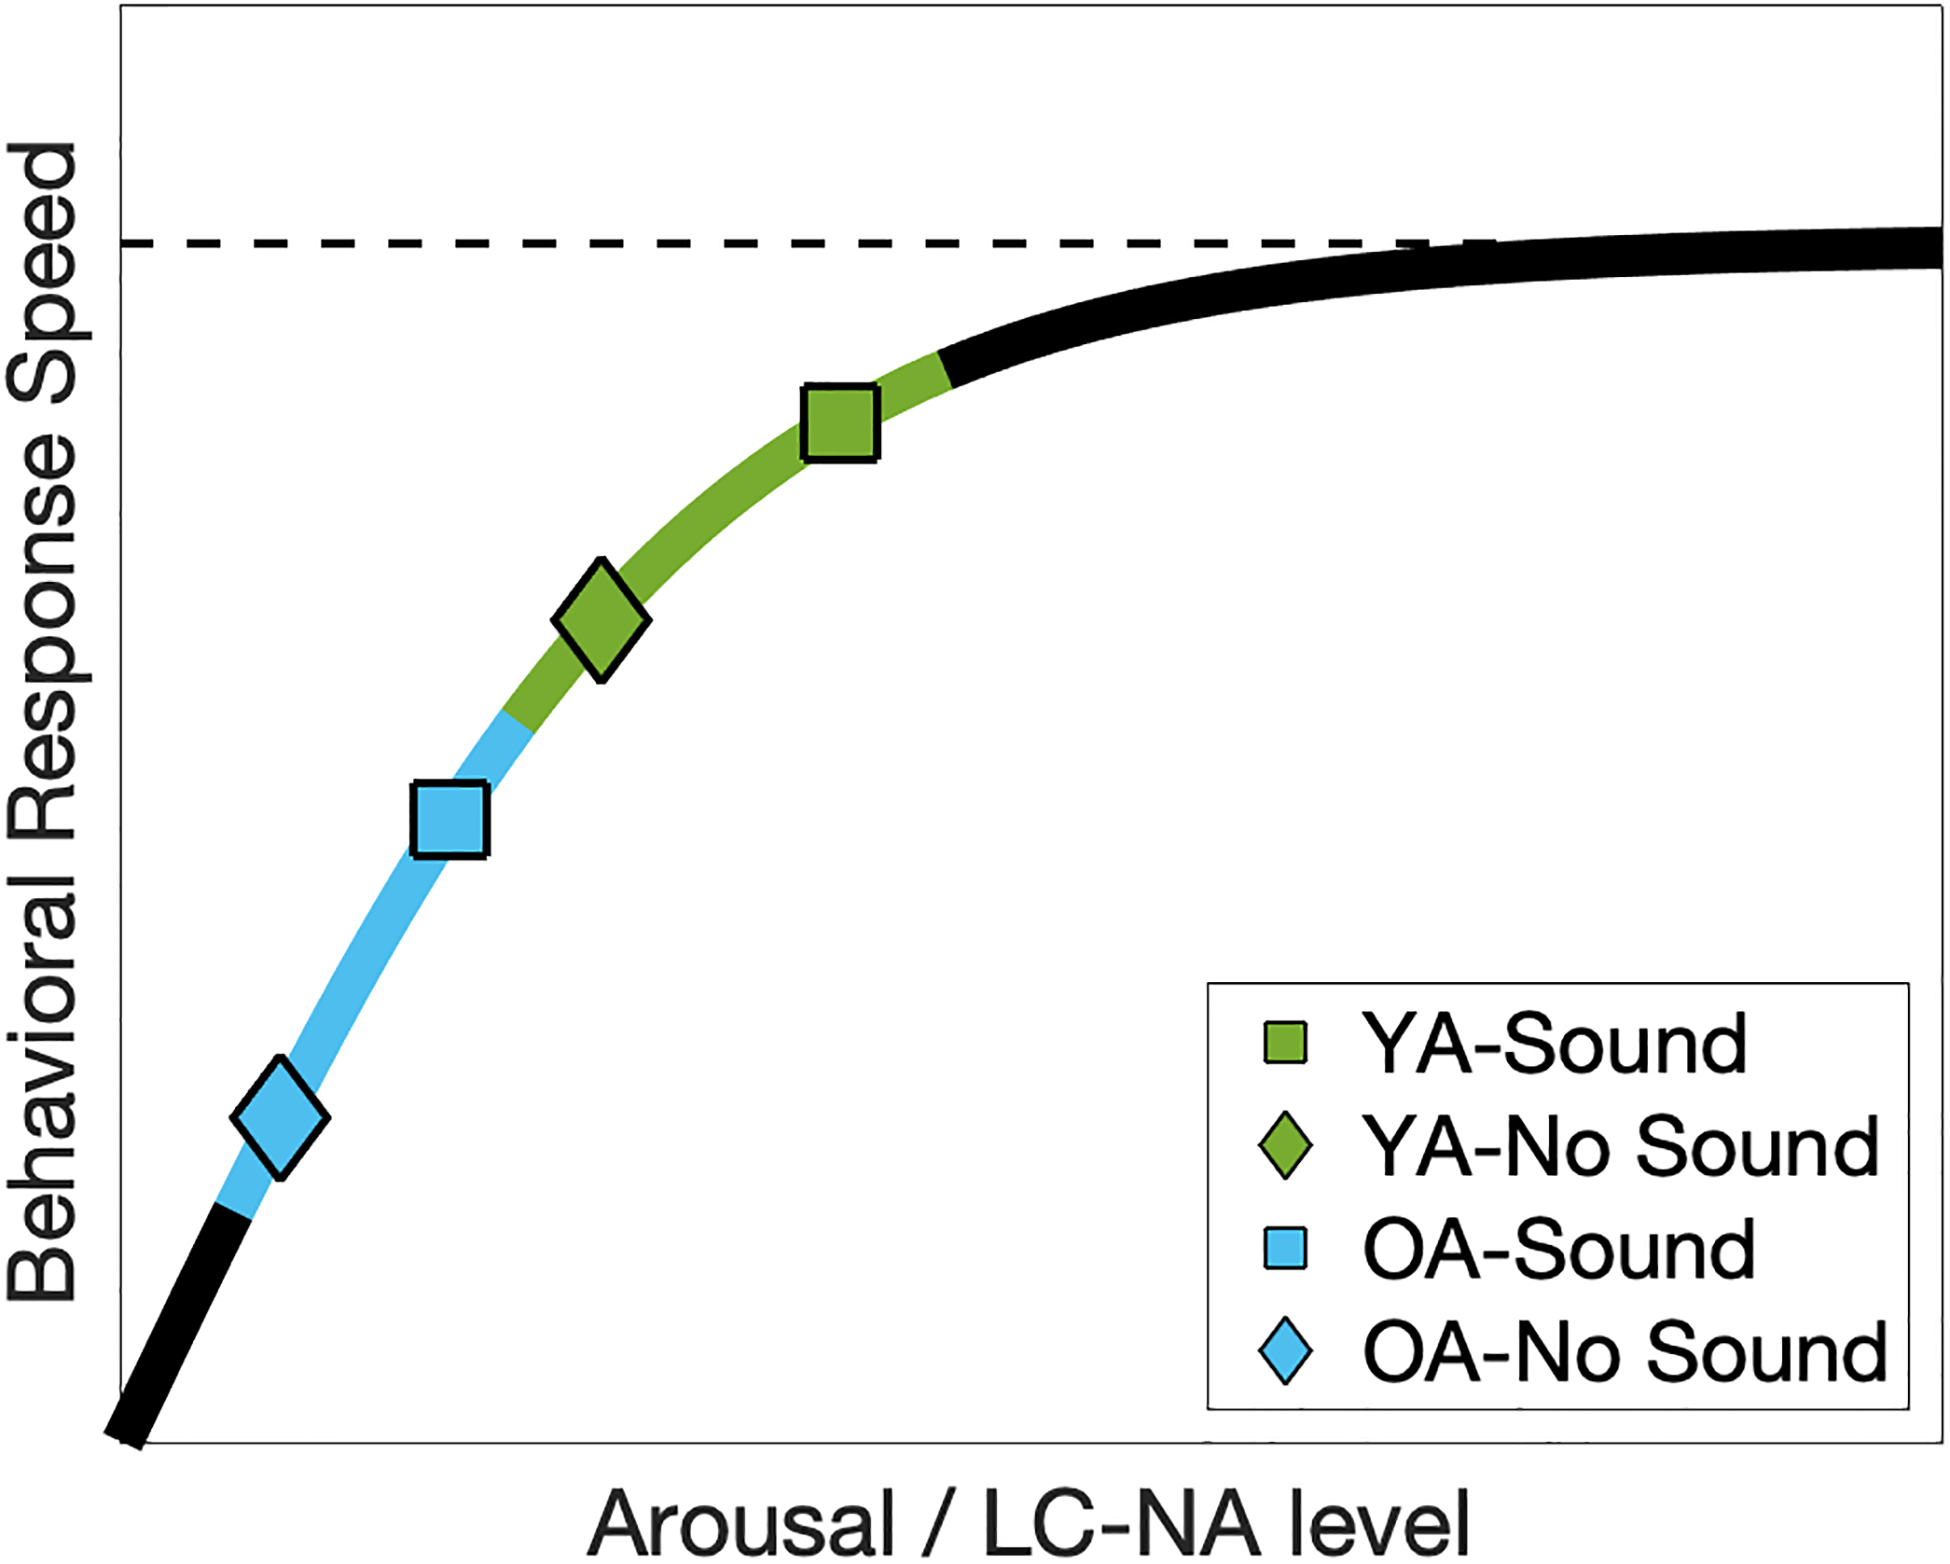
Figure 10.

Schematic curve of the association between behavioral response speed and trial pupil diameter in different sound conditions. Observed reduction in the association strength in the Sound condition in the YA group can be explained by a saturating effect of LC-NA signaling on behavioral performance when the arousal level is sufficiently high. In contrast, the auditory warning tone increases arousal level in the OA group to a higher level but with similar slope in relating to behavioral performance as in the No Sound condition. In addition, at the lower end of this curve, slower responses are more likely to benefit from a greater increase in LC-NA in the Sound condition, explaining the observed group-level correlation between pupillary alerting effect and mean reaction times in the OA group (Figure 6). YA=Young Adults (in green); OA=Older Adults (in blue).
