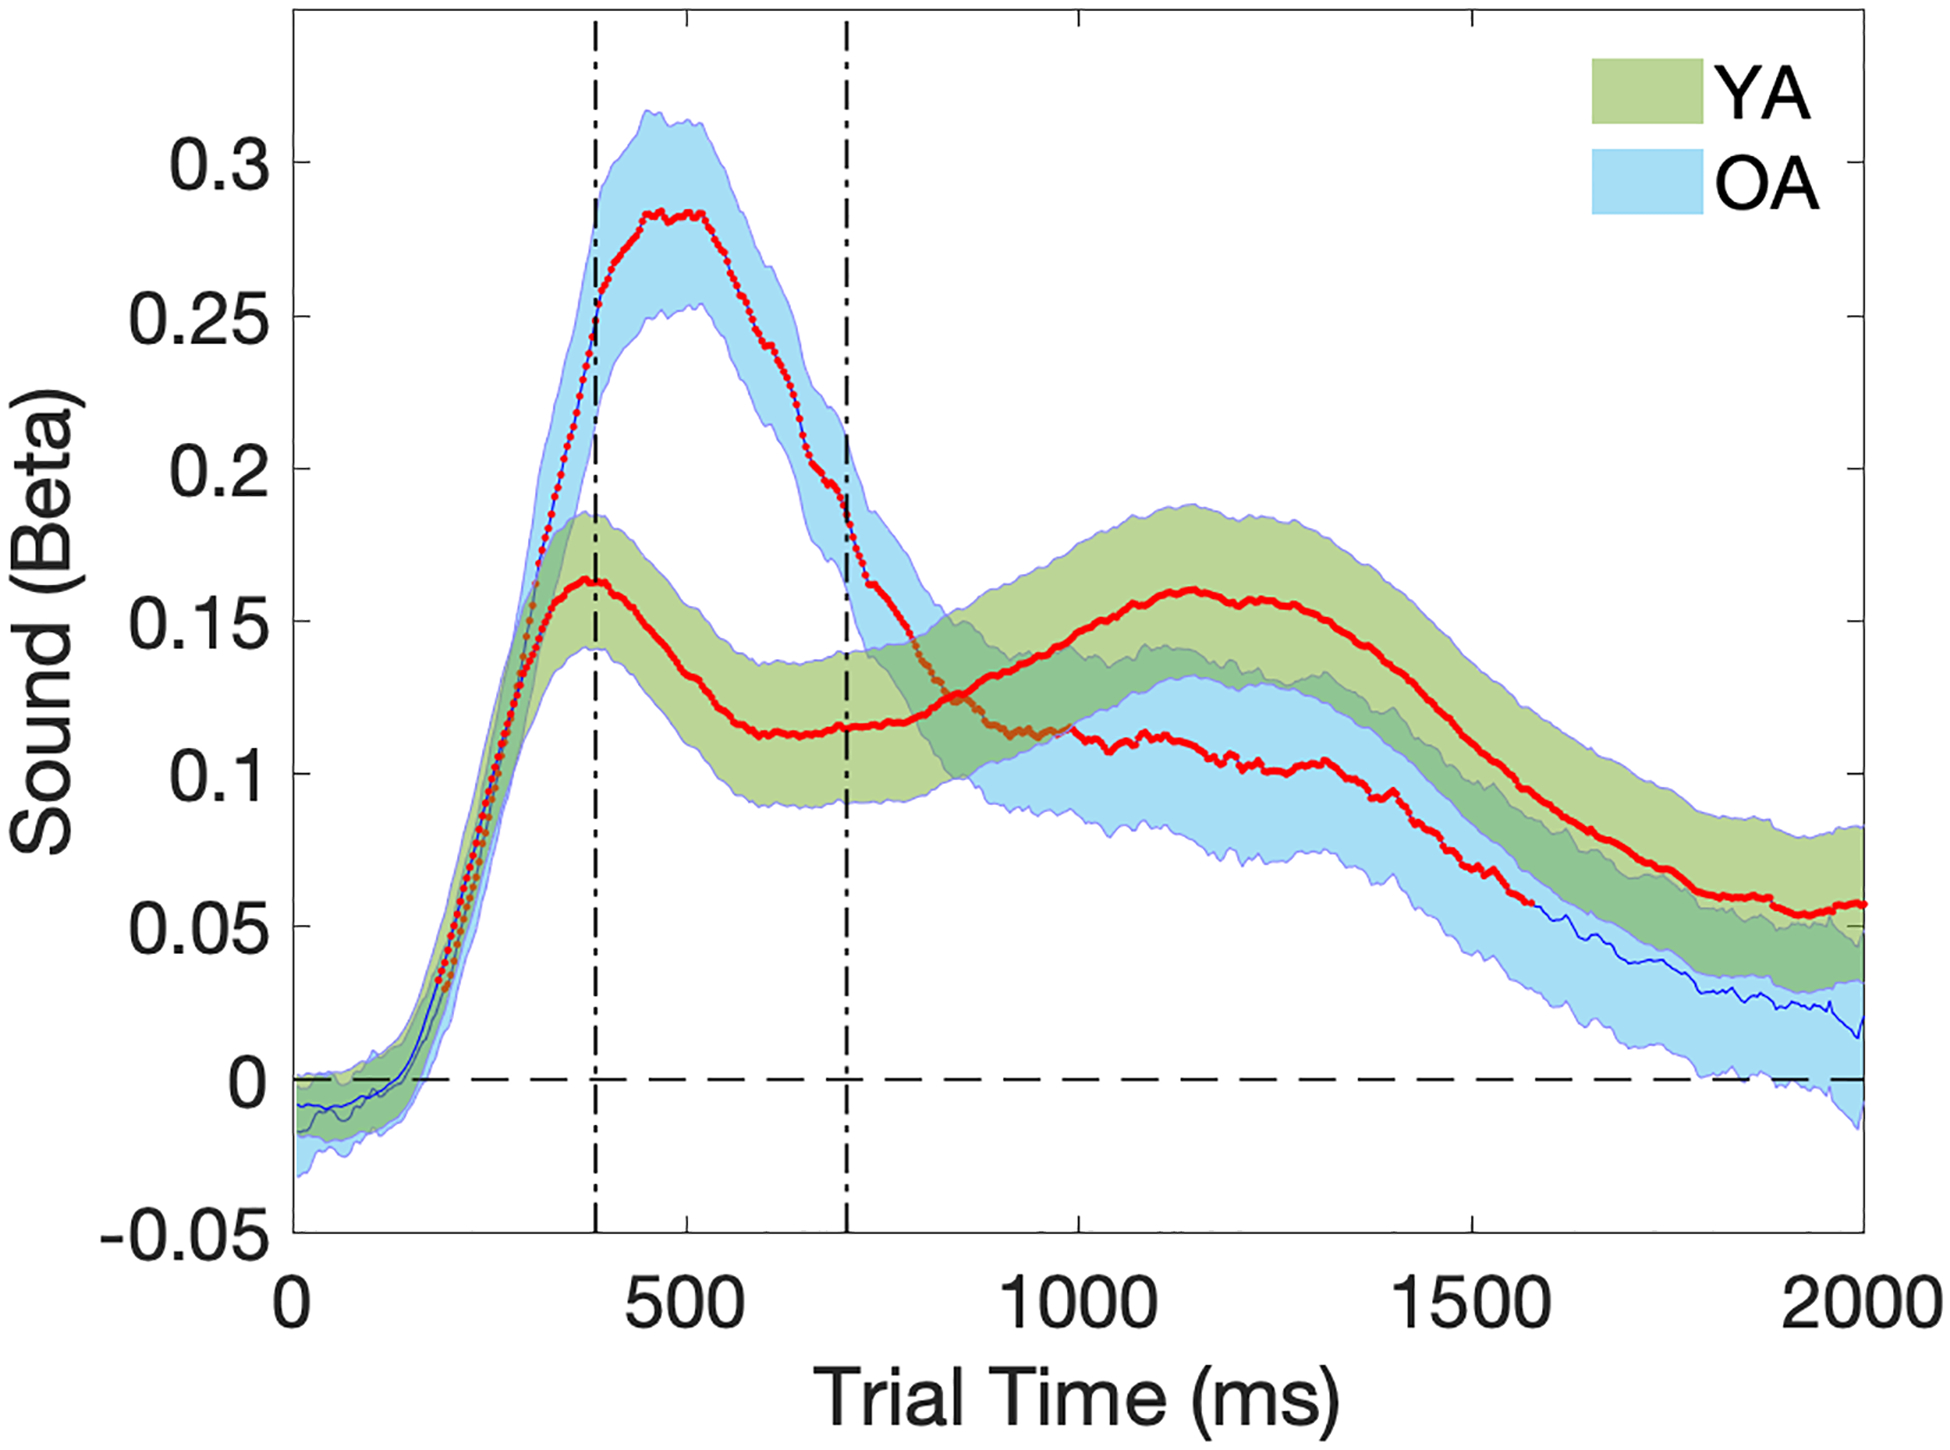
Figure 5.

Temporal plots (2000ms) of pupillary response curves for the auditory tone. Beta (Sound) on the y-axis represents the effect size of increase in trial pupil diameter in z-score units in the Sound condition compared to the No Sound condition. Shaded areas represent the standard error of the mean. Time points with significant p-values at one-sample t-tests are marked in red to indicate group distributions of Beta (Sound) that are significantly different from zero. Vertical dotted lines indicate the time window during which a group-level regression revealed significant age group difference. YA=Young Adults (in green); OA=Older Adults (in blue).
