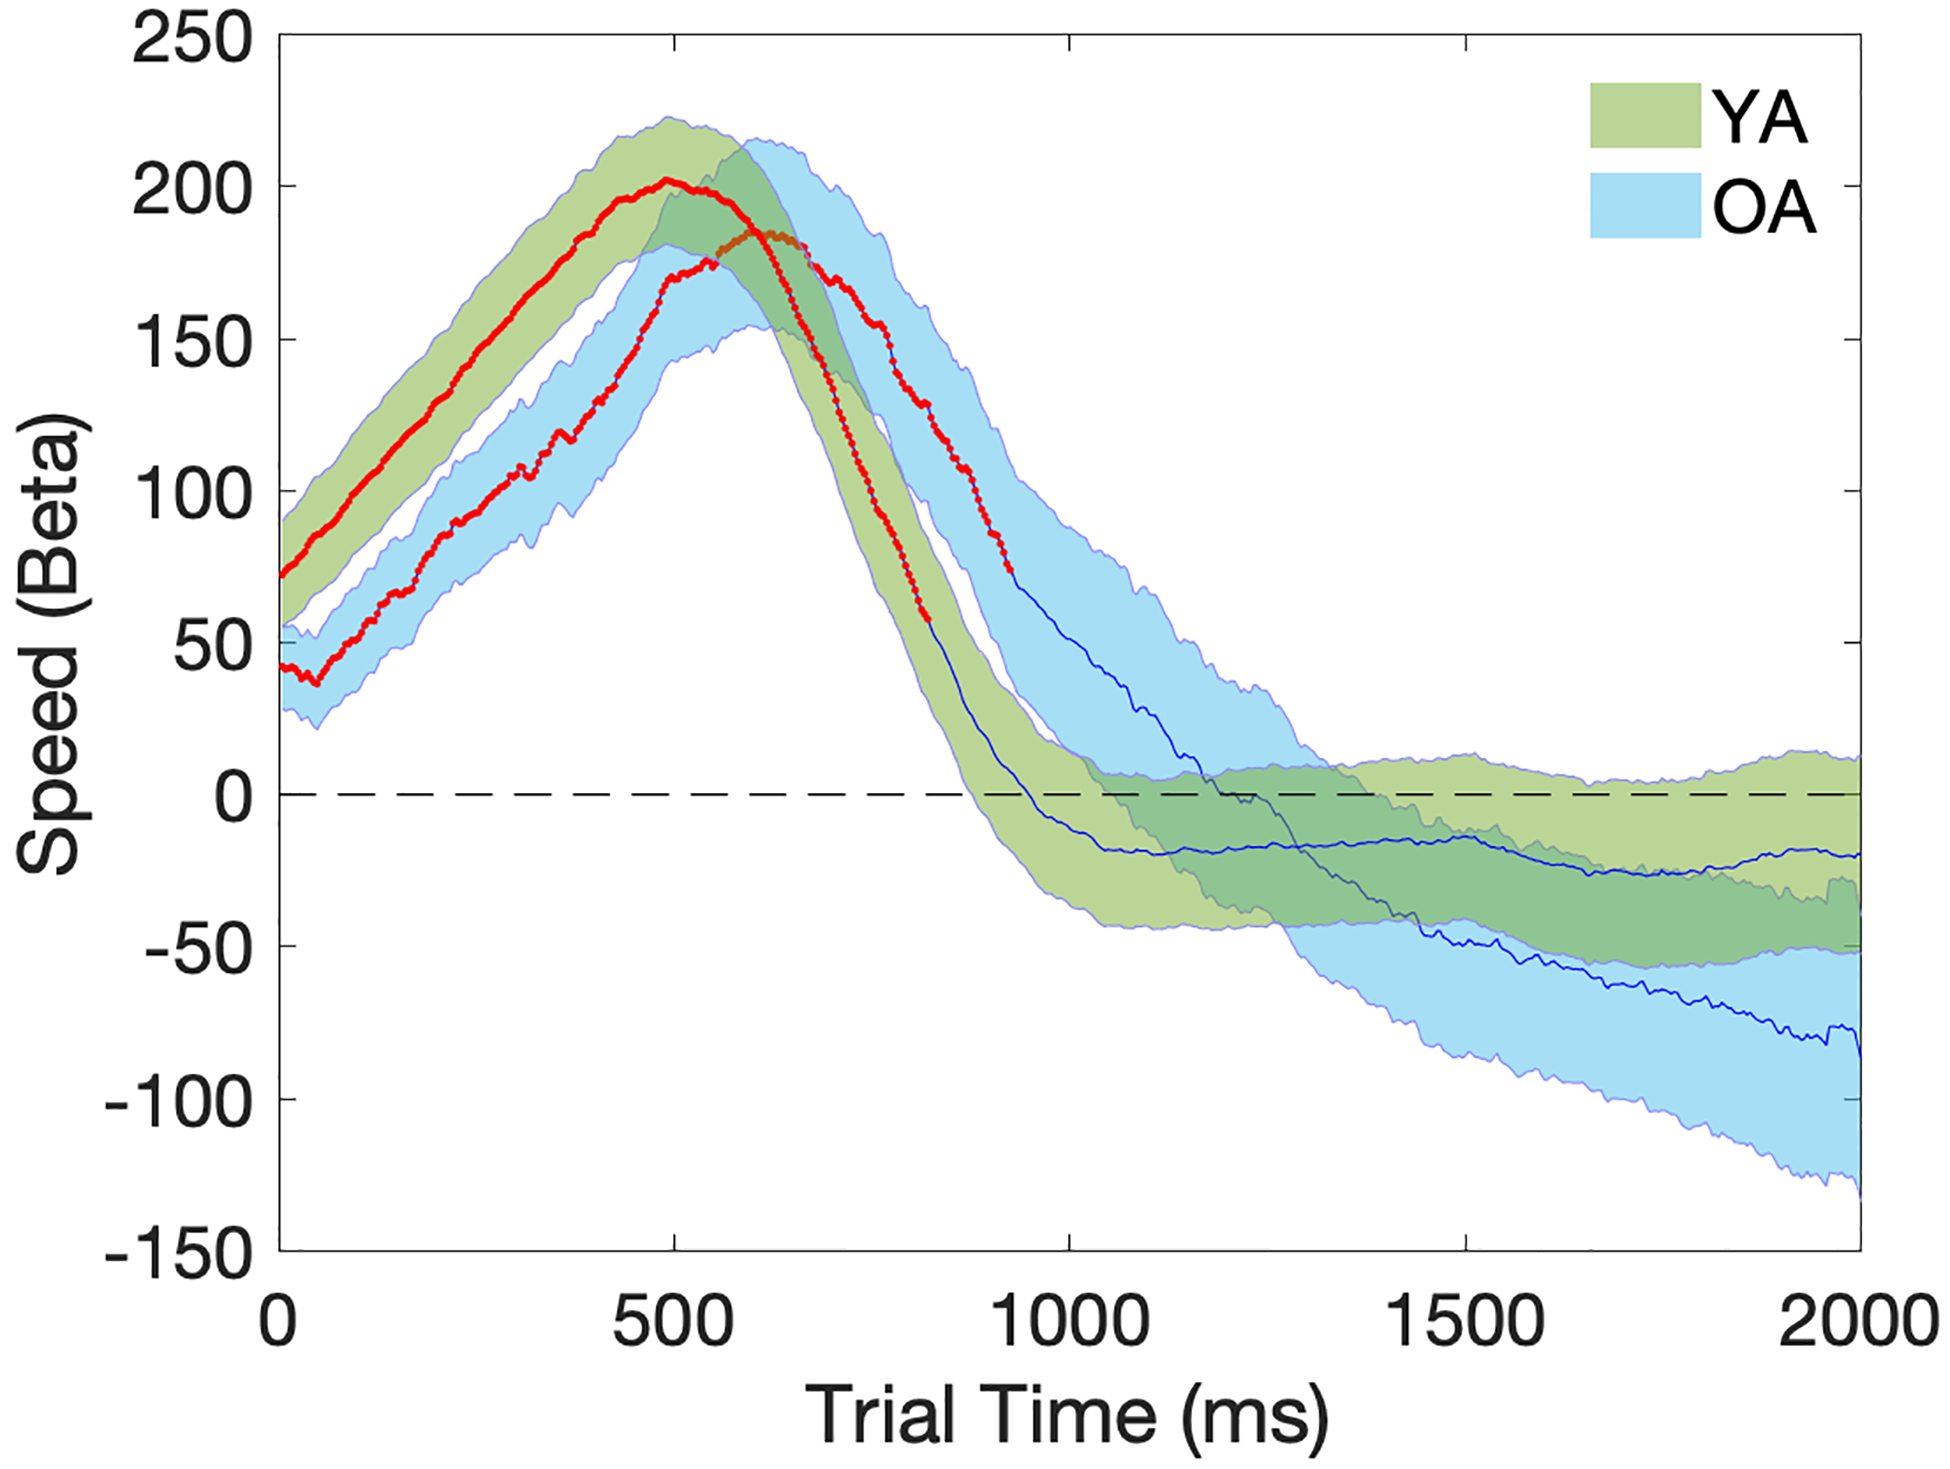
Figure 7.

Temporal plots (2000ms) of regression coefficients for the Speed (response speed) term in the trial pupil diameter regression model. Beta (Speed) on the y-axis represents the correlation across trials between response speed and trial pupil diameter after controlling for other independent variables in the same model. Shaded areas represent the standard error of the mean. Time points with significant p-values at one-sample t-tests are marked in red. YA=Young Adults (in green); OA=Older Adults (in blue).
