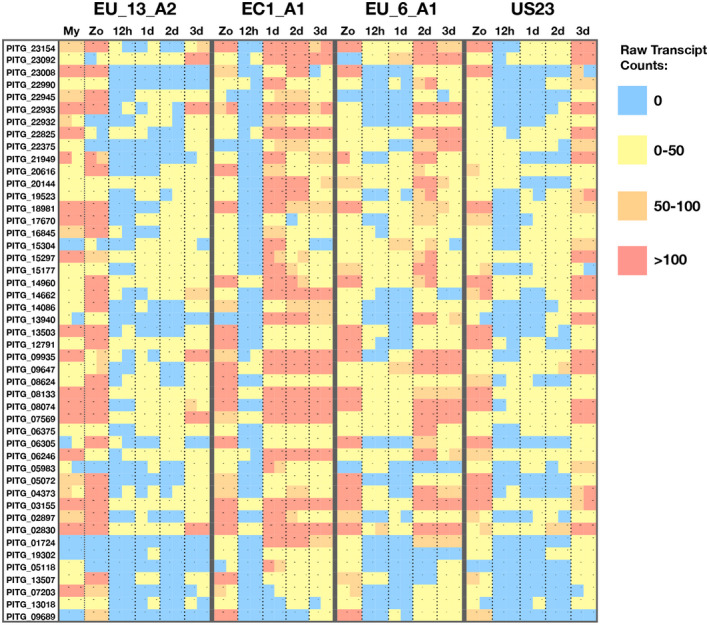
FIGURE 3.

Raw transcript counts for the new candidate RXLR effectors. The 47 most differentially expressed RXLR effectors from the previously untested set were selected, and the raw transcript counts were visualized as a heat map across time points and treatments. Each square indicates a single data point derived from two independent biological replicates. The colours red, orange, yellow, and blue represent >100, 50–100, 0–50, or 0 raw transcripts, respectively
