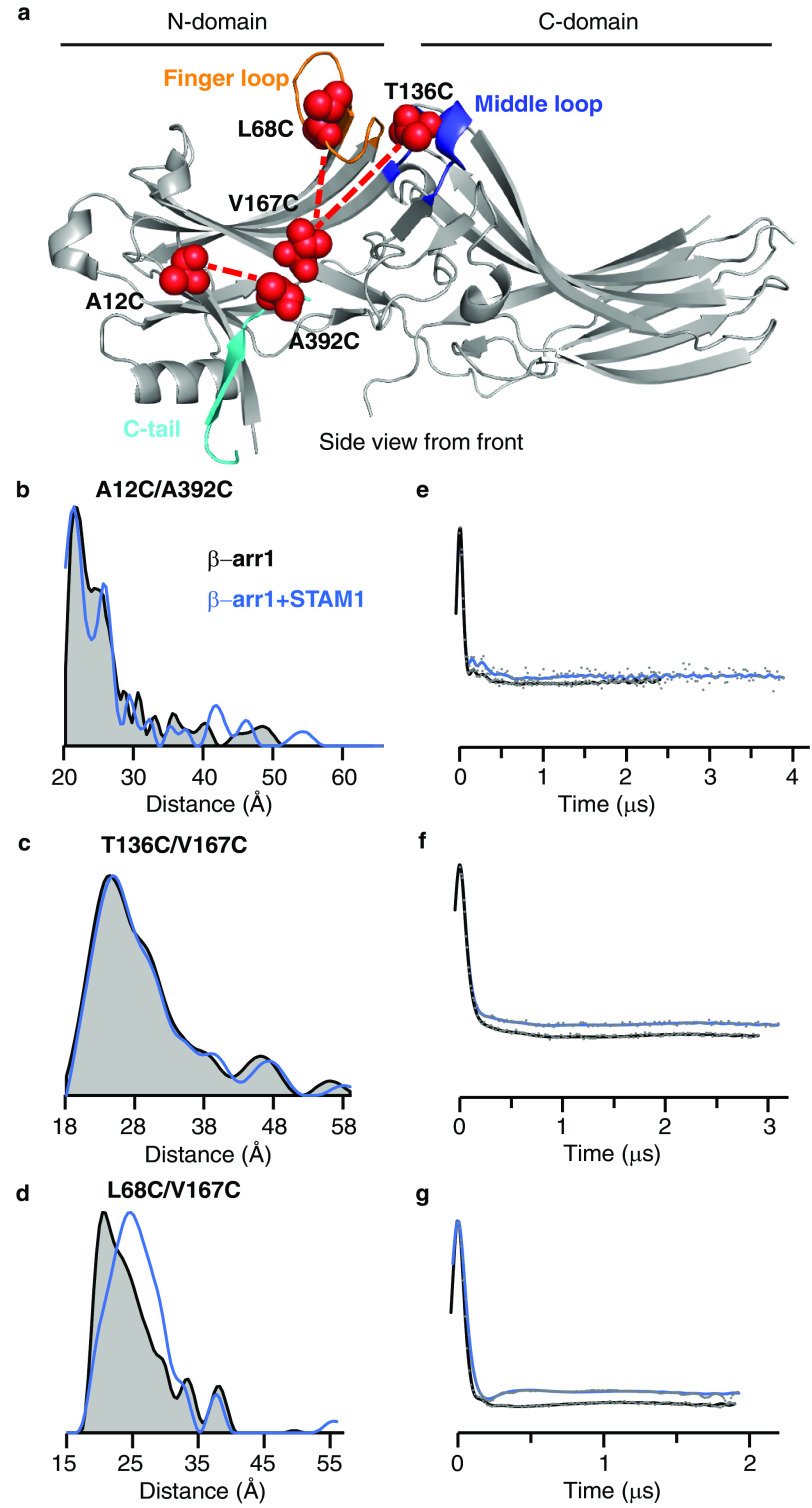
Figure 1.
DEER measurements reveal conformational changes in β-arr1 induced by STAM1. a, structure of inactive β-arr1 (PDB code 1G4M (6)) highlighting the finger loop (orange), C-tail (cyan), and middle loop (blue). Residue pairs selected for DEER are connected by dotted lines. Each spin-labeled β-arr1 double cysteine mutant was analyzed by DEER with and without STAM1. Sample concentrations were as follows: 50 μm spin-labeled β-arr1 and 150 μm STAM1. b–d, DEER-derived distance probability distributions are shown as overlays for the free (gray area with black outline) and STAM1-bound (blue line) states. e–g, background-corrected dipolar evolution curves are plotted as overlays for the free (black line) and STAM1 bound states (blue line). Gray dots represent the raw data.

