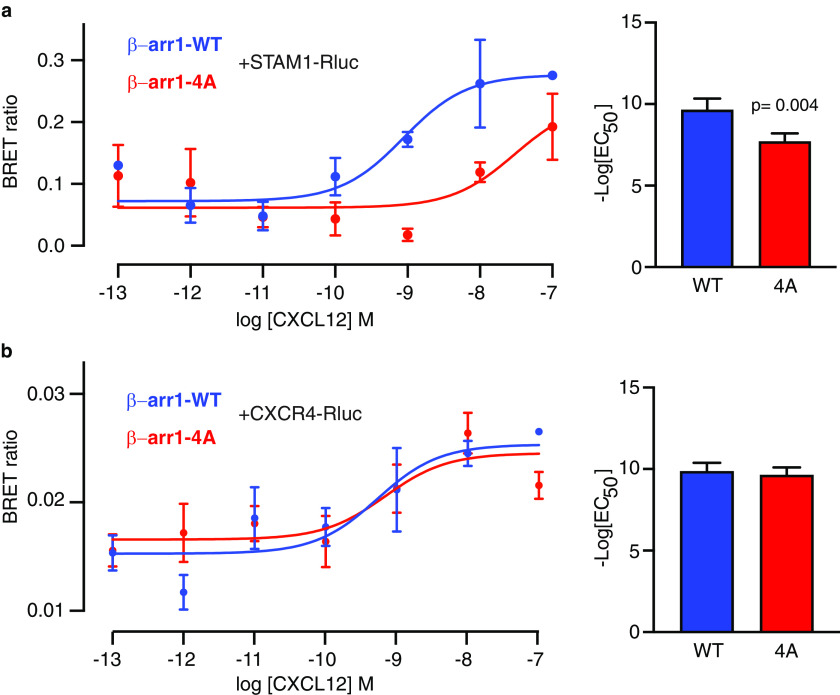
Figure 7.
BRET analysis of β-arr1 binding to STAM1 or CXCR4 in cells. a and b, cells co-transfected with β-arr1–WT–GFP10 or β-arr1–4A–GFP10 with HA–CXCR4 and STAM1–Rluc (a) or CXCR4–Rluc (b) were stimulated with increasing concentrations of CXCL12 for 2 min before BRET measurements. DeepBlueC was added in the continuous presence of CXCL12, and BRET measurements were taken 30 min after the addition of the luciferase substrate. The data shown are from a representative experiment performed in triplicate ± S.D. The curves were fitted by nonlinear regression, assuming a single binding site (GraphPad Prism). The bar graphs represent the average EC50 values from four independent experiments. The error bars represent the S.D. The data were analyzed by unpaired t test. The p values are indicated.

