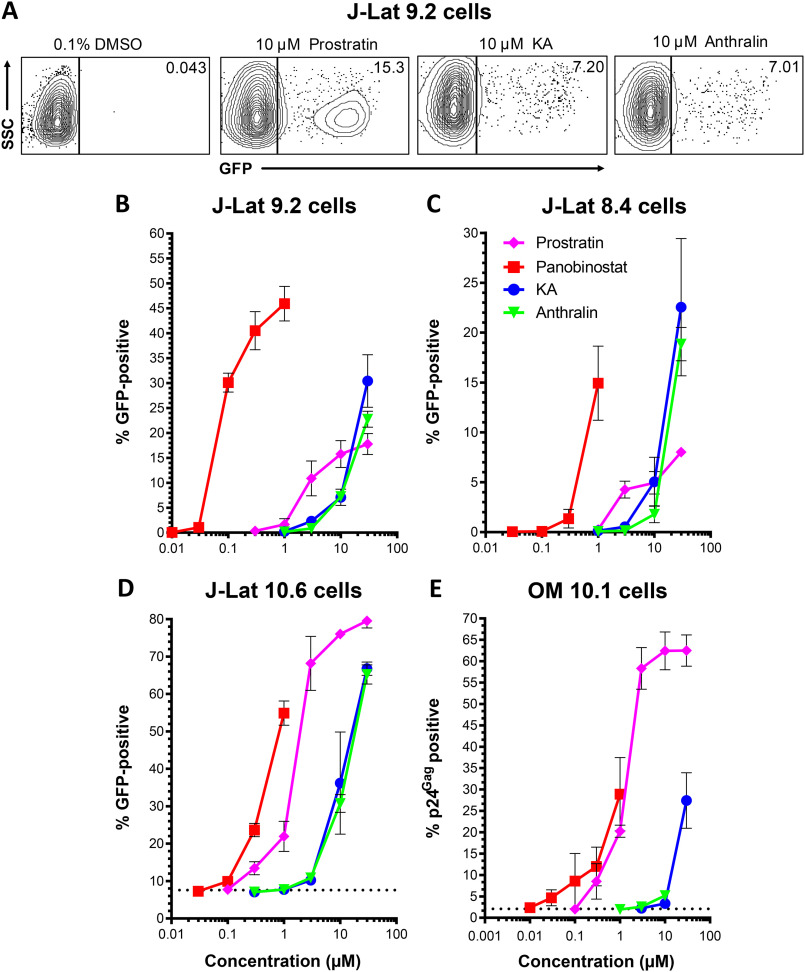
Figure 2.
KA and anthralin reverse HIV latency in vitro. A, representative flow cytometry data showing latency reversal, as measured by GFP expression, in J-Lat 9.2 cells. Values indicate percentage GFP-positive cells for each condition. B–D, dose-response profiles of control LRAs panobinostat and prostratin, in addition to KA and anthralin, are shown in J-Lat 9.2 (B), J-Lat 8.4 (C), and J-Lat 10.6 (D) T cells. E, dose-response profiles of LRAs in OM10.1 promyeloid cells, as measured by cellular expression of viral p24Gag protein. Dotted lines in C and D indicate baseline levels of spontaneous latency reversal. Error bars, S.D.

