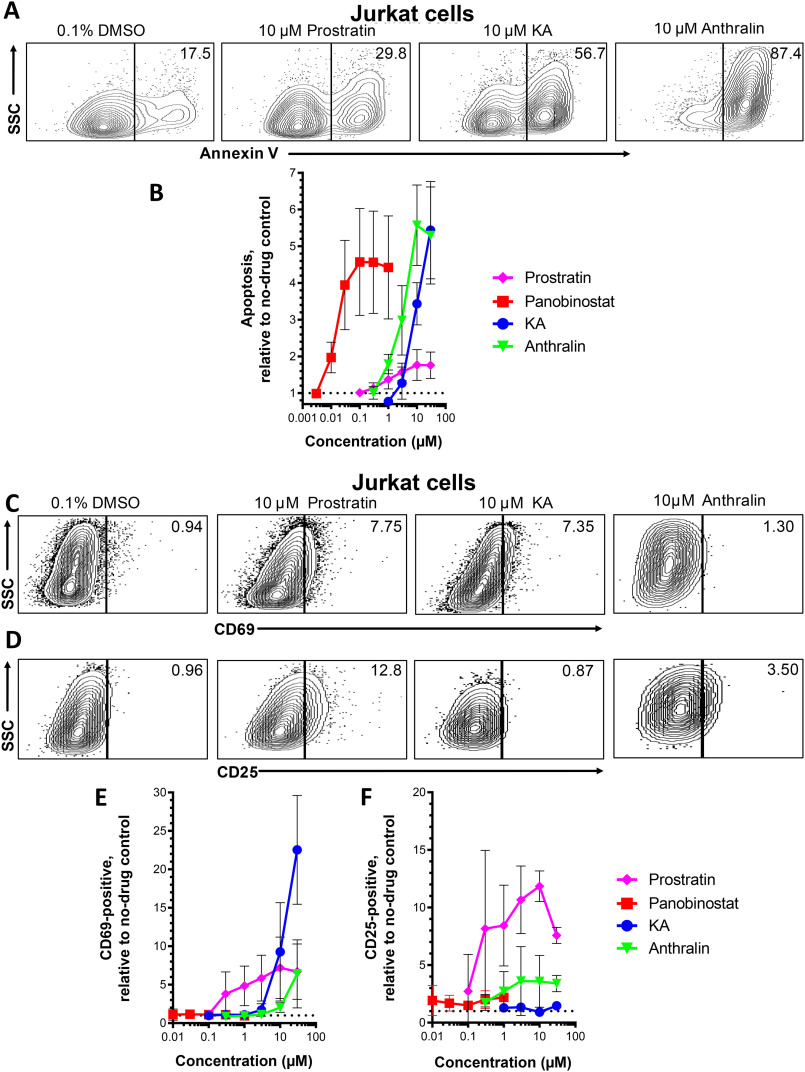
Figure 3.
Effects of LRAs on in vitro cell viability and expression of cell activation markers. A, representative flow cytometry data showing Jurkat cell apoptosis, as measured by annexin V detection. Values indicate percentage of annexin-positive cells. B, dose-response profiles of panobinostat, prostratin, KA, and anthralin on apoptosis in Jurkat cells. Data are presented as -fold increase in annexin V–positive cells relative to cells treated with 0.1% DMSO (dotted line). C and D, representative flow cytometry data showing Jurkat cells stained for CD69 (C) or CD25 expression (D). Values indicate percentage of CD69- or CD25-positive cells, respectively. E and F, dose-response profiles of LRAs on CD69 (E) and CD25 (F) expression in Jurkat cells. Data are presented as -fold increases in each marker relative to cells treated with 0.1% DMSO (dotted lines). Error bars, S.D.

