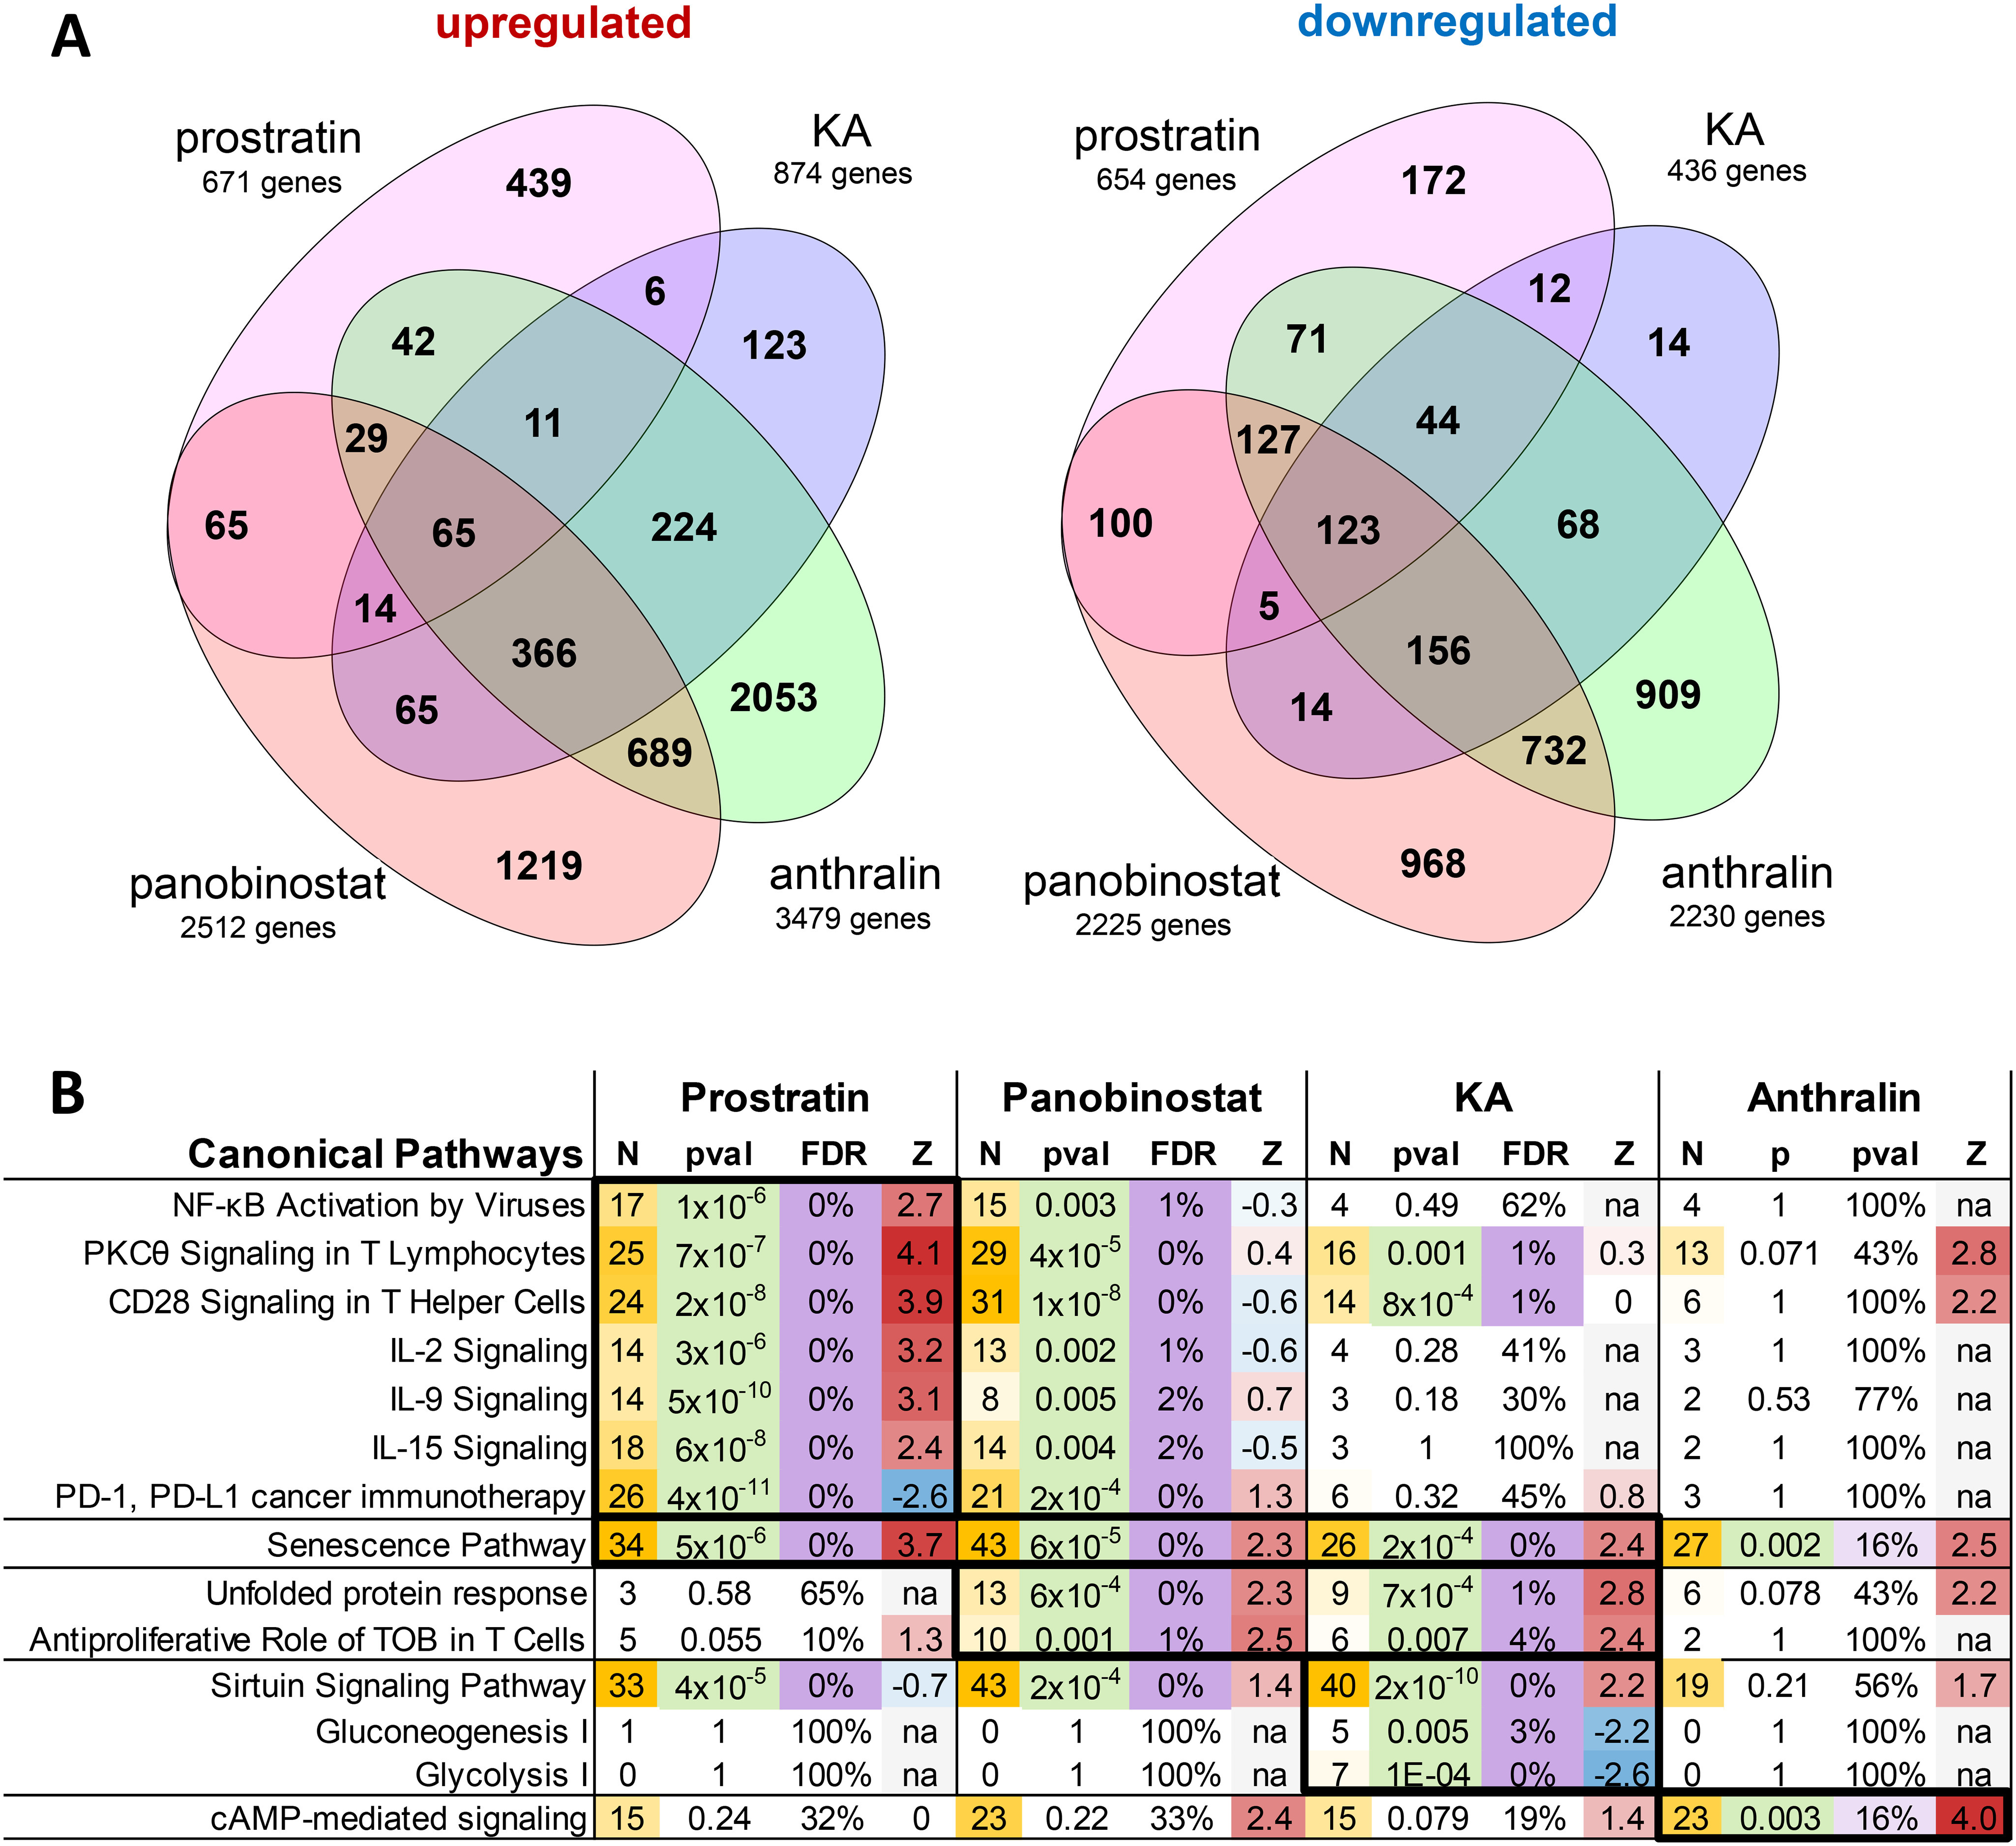
Figure 6.

Effects of LRAs on in vitro global gene expression as measured by RNA-Seq. A, Venn diagrams showing number of significantly up-regulated or down-regulated genes (FDR < 5%) in J-Lat 10.6 cells treated with prostratin, panobinostat, KA, or anthralin, when compared with cells treated with 0.1% DMSO. B, Ingenuity Pathway Analysis results of genes identified in A that passed FDR < 5% and |Z-score| > 2 thresholds. For each pathway, data listed include Z-scores (Z) for predicted pathway state (where positive and negative values indicate activation or inhibition by treatment, respectively), number of affected genes (N), p value (pval), and FDR. p values < 0.05, FDR < 5% (or <20% for anthralin) thresholds are highlighted. Number of genes and Z-scores are highlighted as scales.
