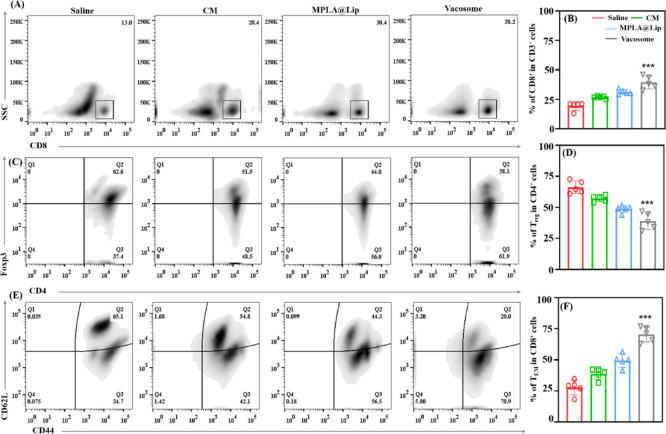
Figure 6.
Immune response caused by the vacosome in the tumor and spleen area. Representative flow cytometry data of (A) CD8+ T cells in the tumor areas (B). Statistical data of CD8+ in the tumor areas. (C) Treg in the tumor areas. (D) Statistical data of Treg in the tumor areas. (E) TCM and TEM in the spleen. (F) Statistical data of TCM and TEM in the spleen. Data represent the mean ± SD (n = 5; ***P < 0.001).

