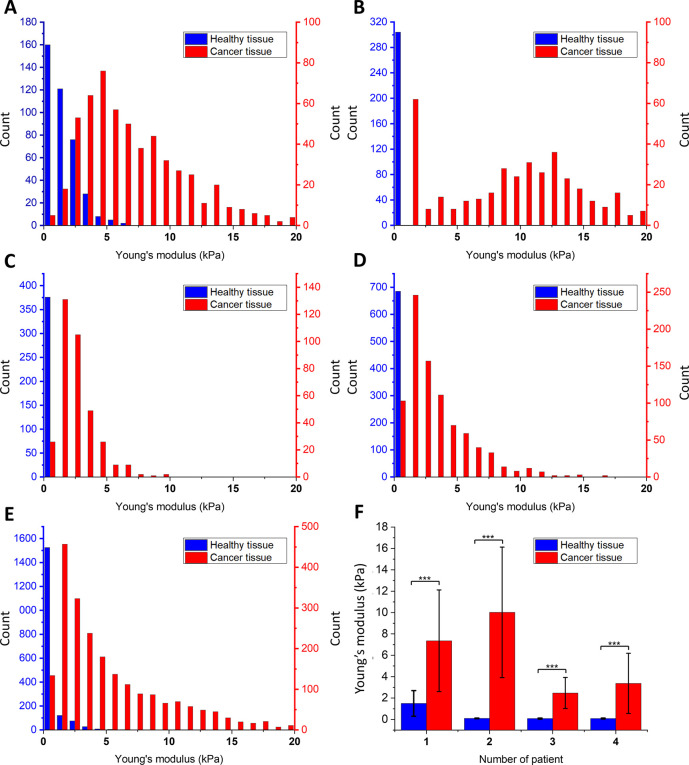
Figure 3.
Young’s modulus values obtained for healthy and cancer tissues using AFM indentation: (A–D) The Young’s modulus distributions for healthy and cancer tissue for each patient. The blue column represents healthy tissues, and the red column represents cancer tissues: (A) patient no. 1; (B) patient no. 2; (C) patient no. 3; (D) patient no. 4; (E) Young’s modulus distribution for healthy and cancer tissue for all patients with fitted probability density function of the log-normal distribution; (F) average Young’s modulus values for each patient demonstrating the significantly smaller deformability of cancerous tissues compared to healthy ones.

