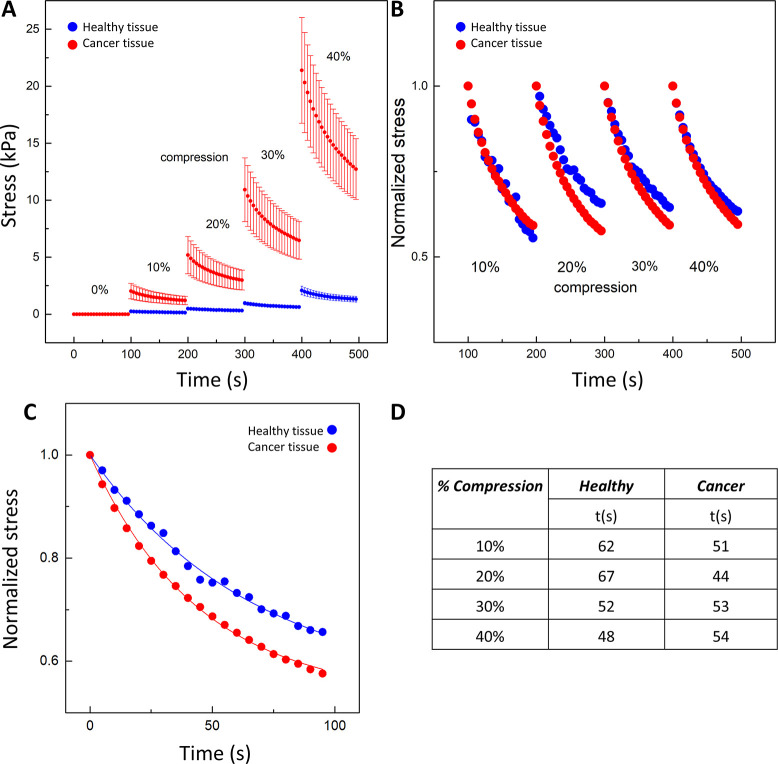
Figure 6.
Axial stress exerted by the tissues at different levels of uniaxial compression, from 0 up to 40% with 10% increments. The amount of stress for healthy (blue) and cancer (red) tissues was calculated by dividing the normal force (FN) registered by the force transducer by the sample surface area in contact with the rheometer plate. (A) Stress–relaxation for cancer and healthy tissues; (B) stress–relaxation normalized to the initial stress just before each compression step; (C) stress–relaxation course for cancer tissue in 20% compression with a two-component stress–relaxation model: σ(t) = 1 – σ∞(1 + e–t/τ), where σ(t) is the reduced relaxation function and σ∞ and τ are the fitting constants for the equilibrium modulus and relaxation time constant, respectively; (D) exponential decay time (t) for cancer and healthy tissues at different levels of compression.56

