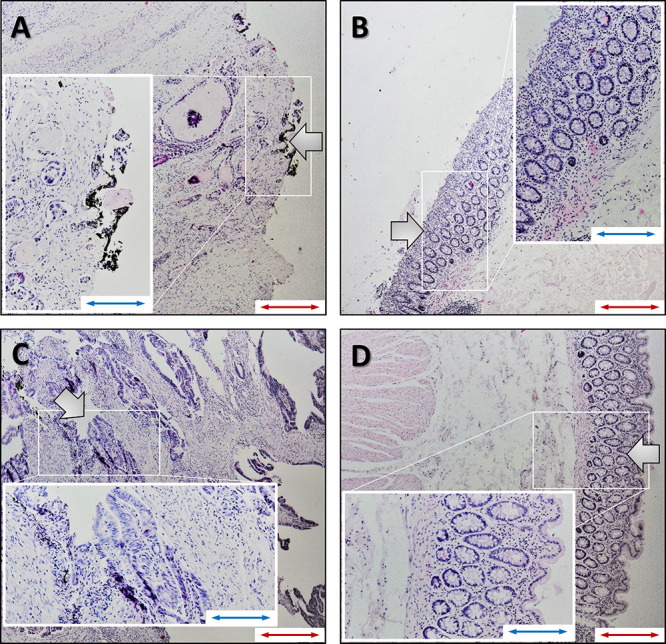
Figure 7.

Representative images of stained colon tissues: (A, C) tumor tissues; (B, D) healthy colon tissues. (A, B) Sample sections from AFM; (C, D) Sections from a sample measured in the rheometer. The morphology of healthy colon tissue shows surface epithelium, mucosa with colon crypts, goblet cells, lamina propria, and muscularis mucosa and submucosa. The crypts open to the surface epithelium in this cross section, and some of the crypts appear partially or below the surface. A section of cancer tissue from AFM (A) shows the infiltration of adenocarcinoma with necrosis in the submucosa together with the desmoplastic reaction and microinflammation. A section of cancer tissue from the rheometer (C) shows the infiltration of adenocarcinoma with a fibrous inflammation reaction. The tissue is damaged due to the destructive nature of the rheometer tests at large strains (red scale bar, 100 μm; blue scale bar, 200 μm). Large arrows indicate the places from which the data was collected.
