
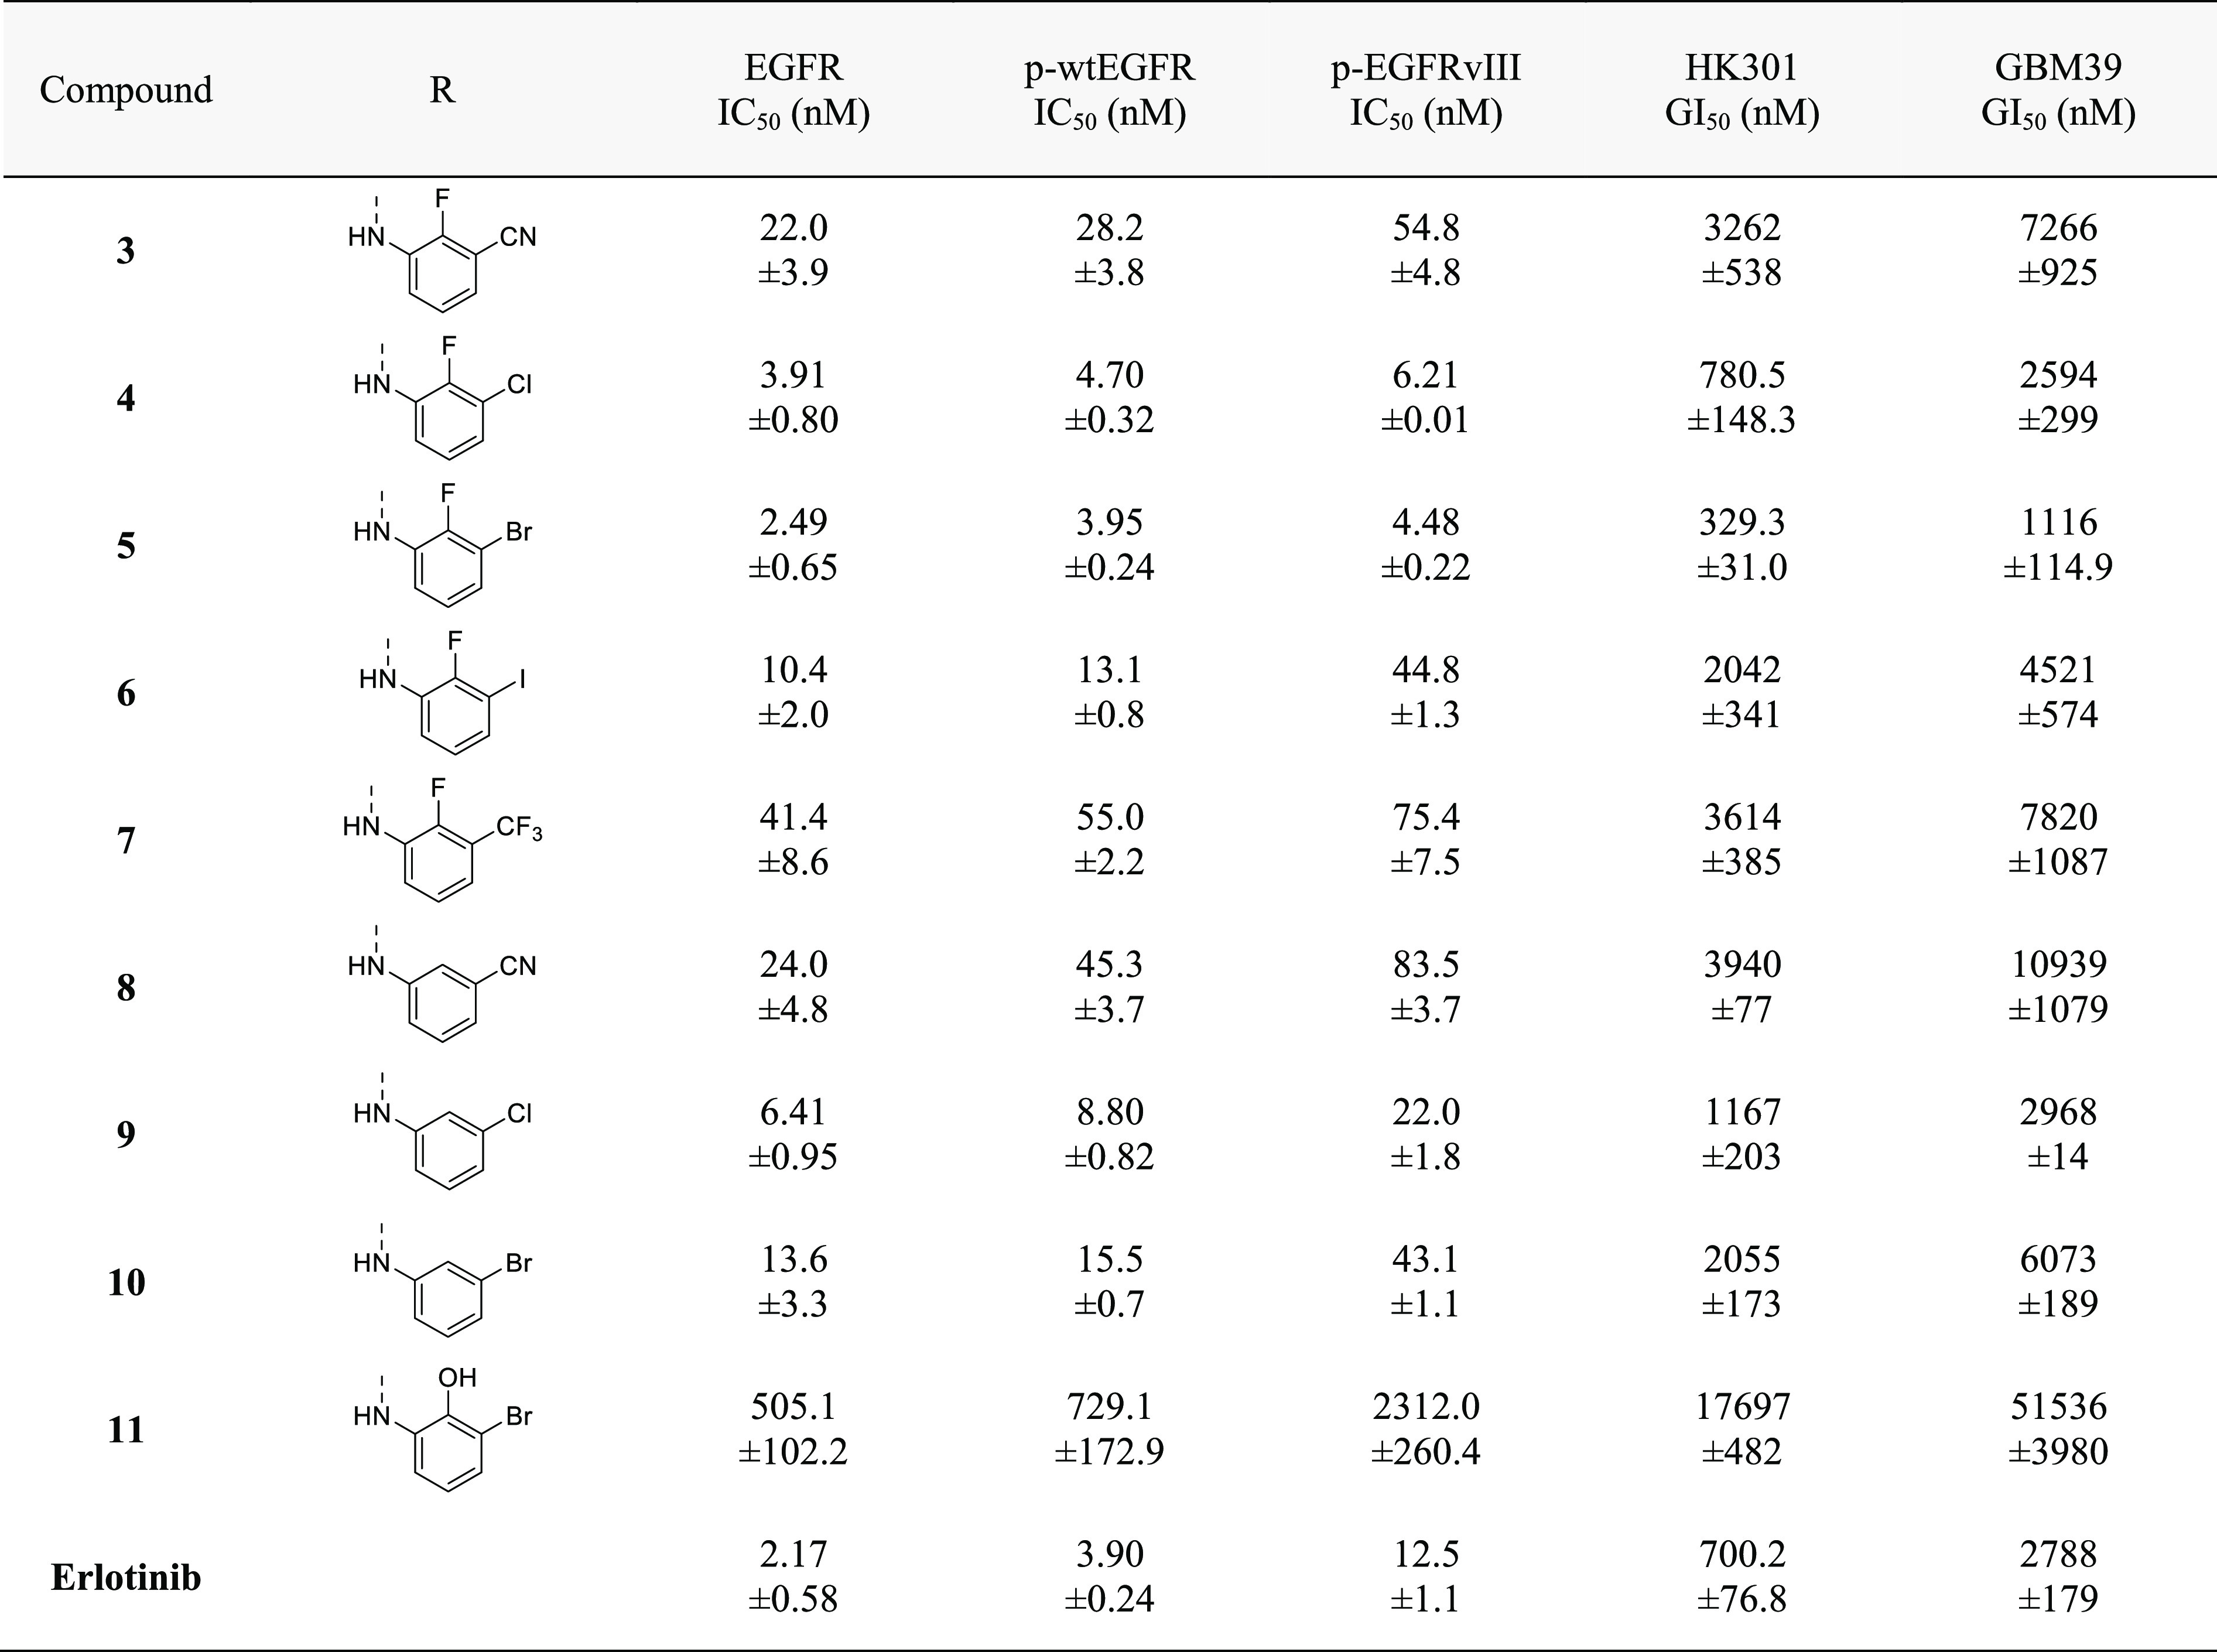
Table 3. Comparison of the 2′- and 3′-Position of 4-Anilinoquinazolinesa.
a
All EGFR inhibition data are represented as mean ± SEM from n = 2 or more independent replicates. All growth inhibition data are represented as mean ± SEM from n = 3 or more independent replicates.