
FIGURE 2.
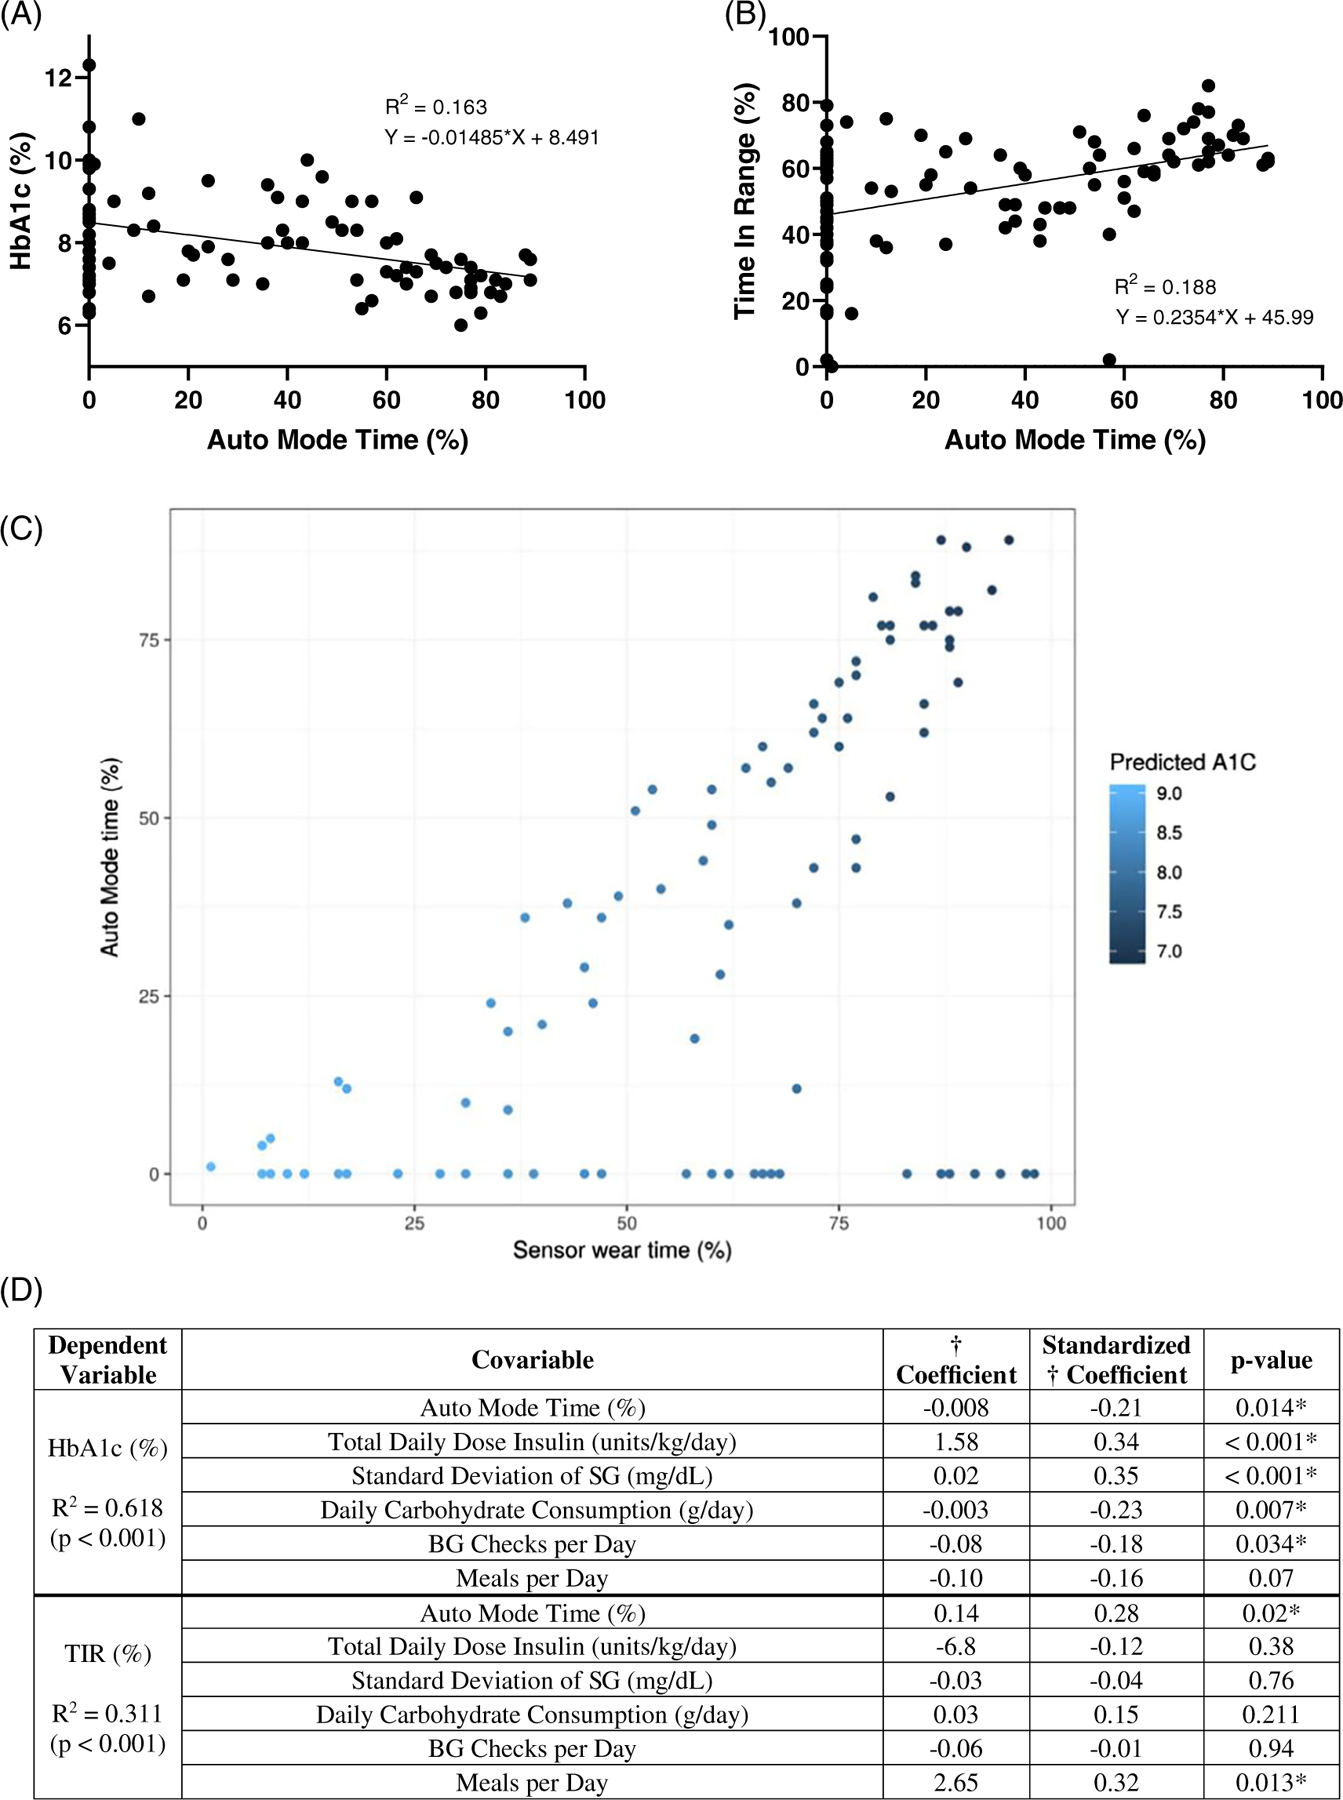
Bivariate and multivariate linear regression analysis. A, Scatterplot depicting bivariate analysis of the effect of Auto Mode time (%) on HbA1c (%). B, Scatterplot depicting bivariate analysis of effect of Auto Mode time (%) on TIR (%). C, Auto Mode time and sensor wear time prediction of HbA1c. Scatterplot depicting predicted HbA1c from a linear model using sensor wear time and Auto Mode time as predictors. Light blue shaded points represent higher predicted HbA1c, dark blue shaded points represent lower predicted HbA1c. D, Correlates with HbA1c and TIR in multilinear regression analysis. Abbreviations: BG, blood glucose; HbA1c, haemoglobin A1c; SG, sensor glucose; TIR, time in range. *Significant P <0.05