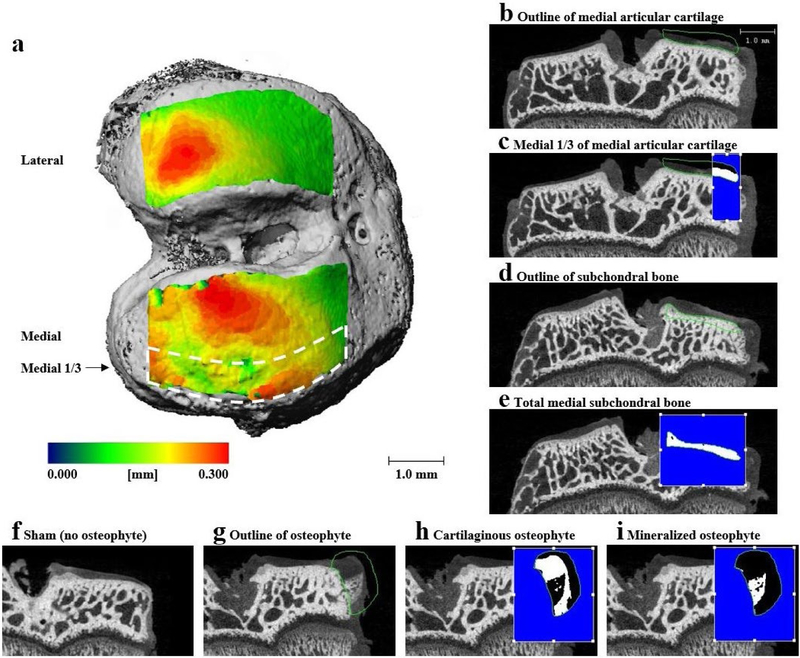
Fig. 1. Representative EPIC-μCT images demonstrating articular cartilage, osteophyte and subchondral bone volume of interest (VOI).
(a) Rat tibial articular cartilage thickness map overlays on bone indicating articular cartilage VOI. (b) Representative images of coronal sections of rat tibial joint showing outline of total medial articular cartilage, (c) medial ⅓ (indicated in white) of medial articular cartilage, outline of (d) medial tibial subchondral bone and (e) cortical subchondral bone (indicated in white) of medial tibia. Representative coronal sections of medial tibial joint illustrating (f) no osteophyte in sham joint, (g) contour of osteophyte in MMT joint, (h) cartilaginous osteophyte volume (indicated in white) in MMT joint and (i) mineralized osteophyte volume (indicated in white) in MMT joint. Scale bar in (a) is universal for all representative images of coronal sections.

