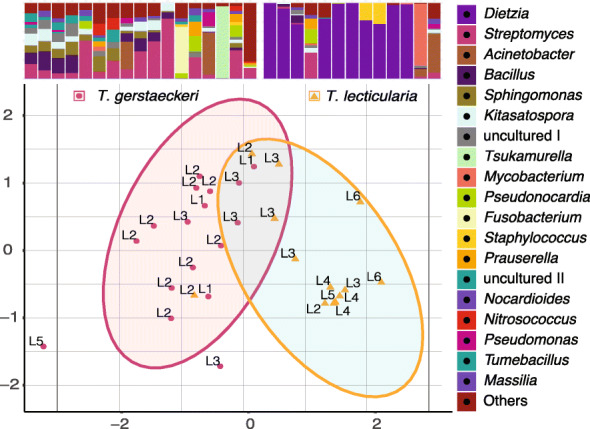
Fig. 4.

Microbiome species-specific differences in a single habitat. NMDS ordination calculated with microbiome Bray-Curtis dissimilarity values from T. gerstaeckeri and T. lecticularia residing in the same nest in Chaparral, TX. Each point represents an individual bug, with the life stage listed next to it. Statistical ellipses were calculated using a 0.05 confidence interval. Microbiome profiles for both species are provided above the plot, with the 20 top bacterial genera colour-coded and listed in decreasing order of abundance to the right of the plot. “uncultured I” stands for bacteria from the order Bacillales, and “uncultured II” for Sphingomonadales.
