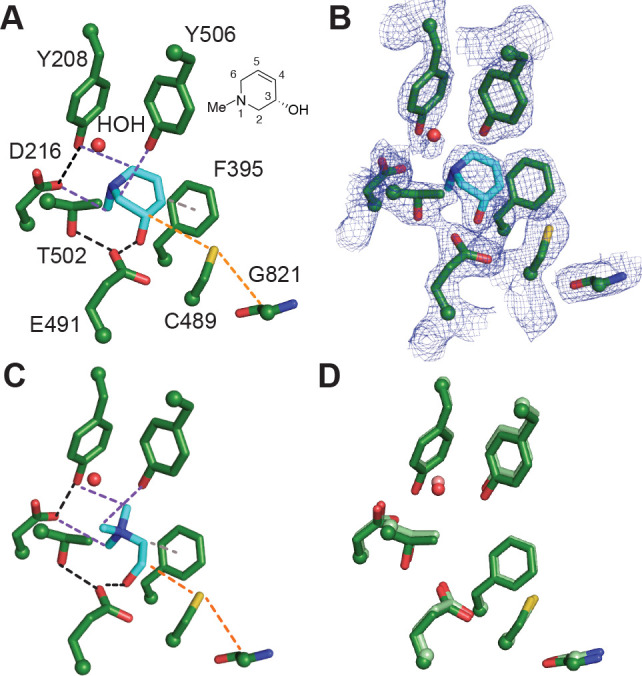
Figure 4.

Binding of (S)-6 to CutC reveals key interactions important for recognition. (A) Crystal structure of unactivated CutC soaked with (S)-6 reveals interactions between bound inhibitor and CutC active site residues. Black dashes represent H-bond interactions, purple dashes represent CHO interactions, gray dashes represent a potential π–π interaction, and orange dashes represent the path of radical transfer. Chemical structure of (S)-6 with numbered atoms is shown next to the structure. (B) Simulated annealing composite omit map (2Fo – Fc, blue mesh) contoured at 1.5σ showing the location of the inhibitor. (C) Previously described crystal structure of unactivated CutC bound to choline (PDB 5FAU). Interactions between CutC and choline are color coded as described above with the exception of a cation−π interaction which is shown in gray dashes. (D) Comparison of choline-bound (protein residues are colored in light green) and (S)-6-bound (colored in green) CutC active sites. Choline and (S)-6 were omitted from the structure for clarity.
