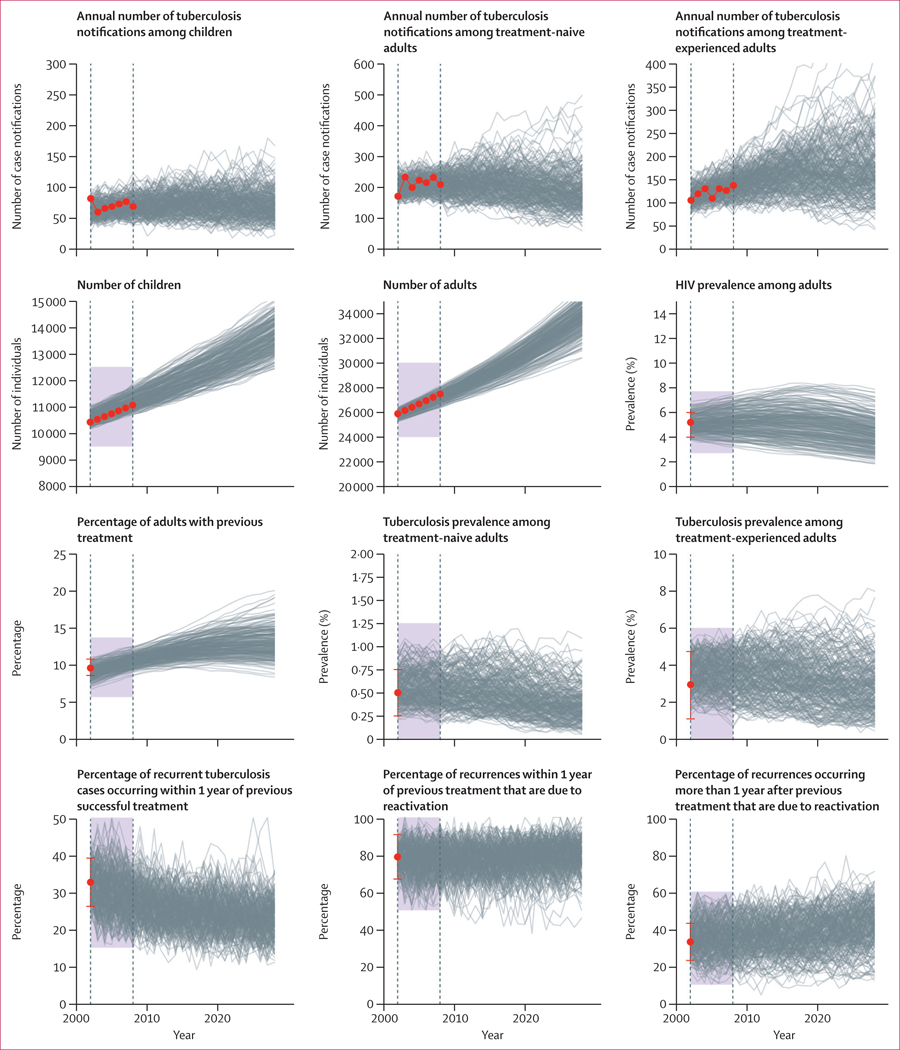
Figure 2: Overview of calibration targets and fitted model trajectories.
Red dots denote the 12 calibration targets, with error bars representing 95% CIs where applicable; grey lines represent 250 simulated trajectories produced by the calibrated model; the simulated trajectories that fell outside of the feasible regions (shaded areas) were considered extremely unlikely and were eliminated by the calibration method. The interval between the dashed vertical lines shows the model calibration period (2002–08).

