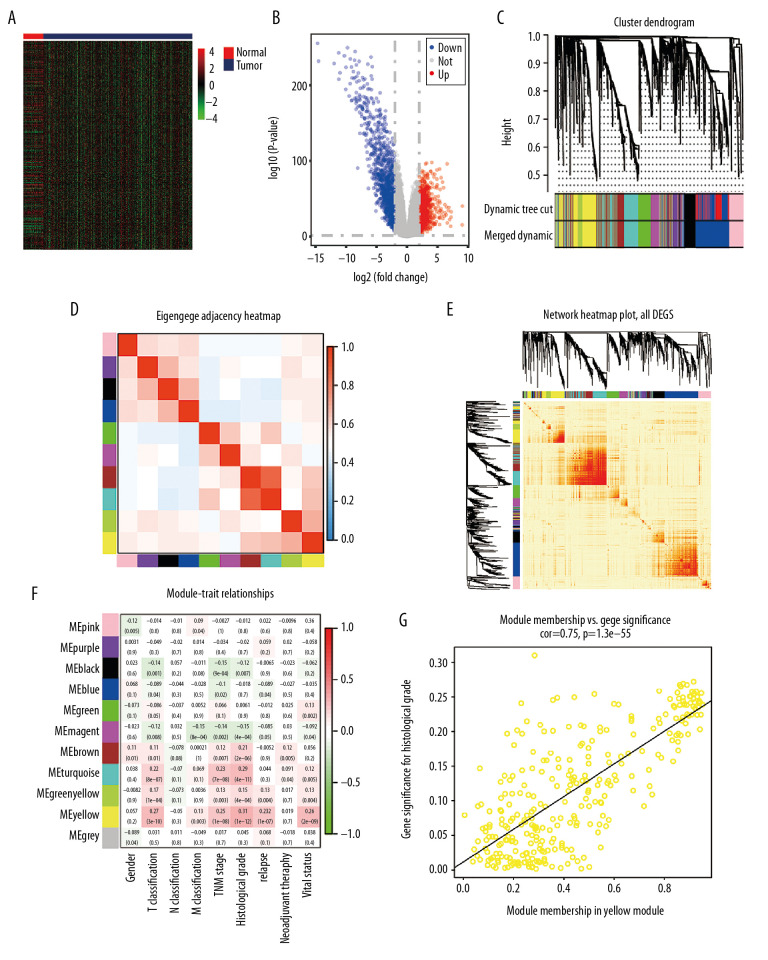
Figure 2.
Bioinformatic analysis of ccRCC and normal kidney samples in the TCGA database.(A, B) The heatmap and volcano plot of the DEGs between 539 ccRCC cases and 72 normal samples. (C) Cluster dendrogram of DEGs and module screening based on gene expression profiles of 539 ccRCC samples. (D, E) Heatmap of the correlation coefficient expressed between modules. (F) Relationships between consensus module eigengenes and various clinical traits. (G) Analogous scatter plots for the yellow module. ccRCC – clear cell renal cell carcinoma; TCGA – The Cancer Genome Atlas; DEGs – differently expressed genes.

