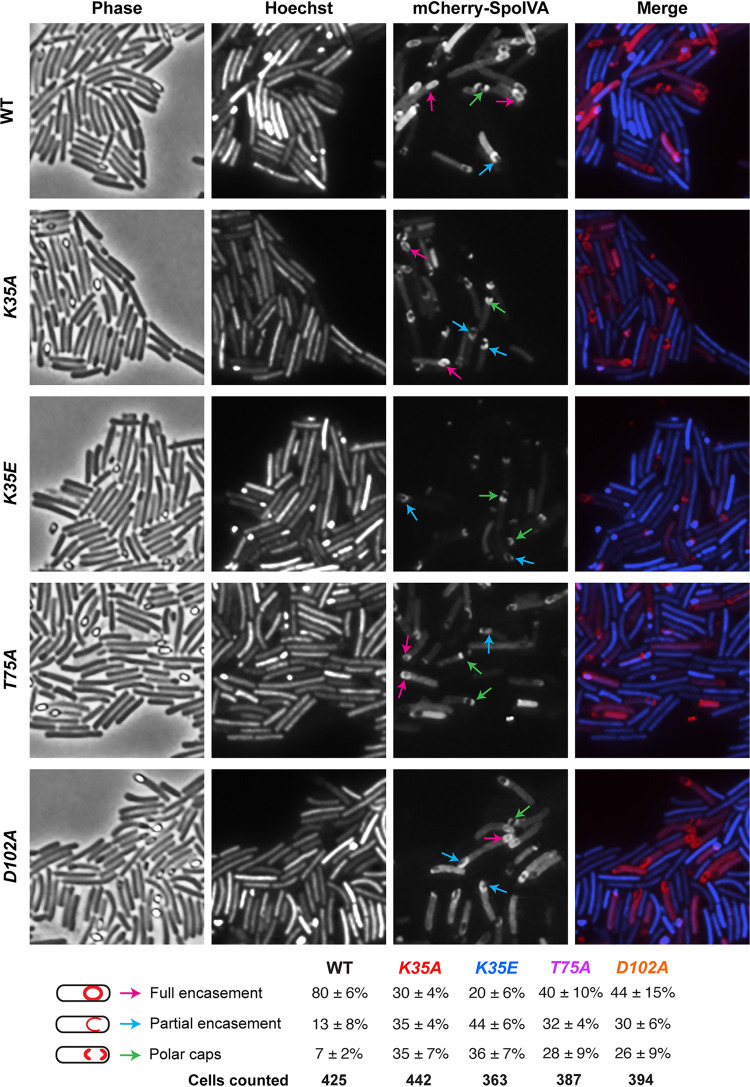
FIG 3.
Effect of SpoIVA ATPase motif mutations on SpoIVA localization. Fluorescence microscopy analyses of wild type and spoIVA mutants encoding ATPase motif mutations in their native locus 23 h after sporulation induction. Phase-contrast microscopy was used to visualize sporulating cells (phase). Hoechst staining used to visualize the nucleoid is shown in blue, and mCherry-SpoIVA fluorescence is shown in red. The merged images of the Hoechst staining and mCherry signal are shown. Schematic of coat localization phenotypes quantified is shown along with the percentage of cells in a given strain that exhibited this phenotype. The average percentages and standard deviations shown are based on counts from three biological replicates, with multiple images from each replicate being quantified. The total numbers of cells counted are also shown.

