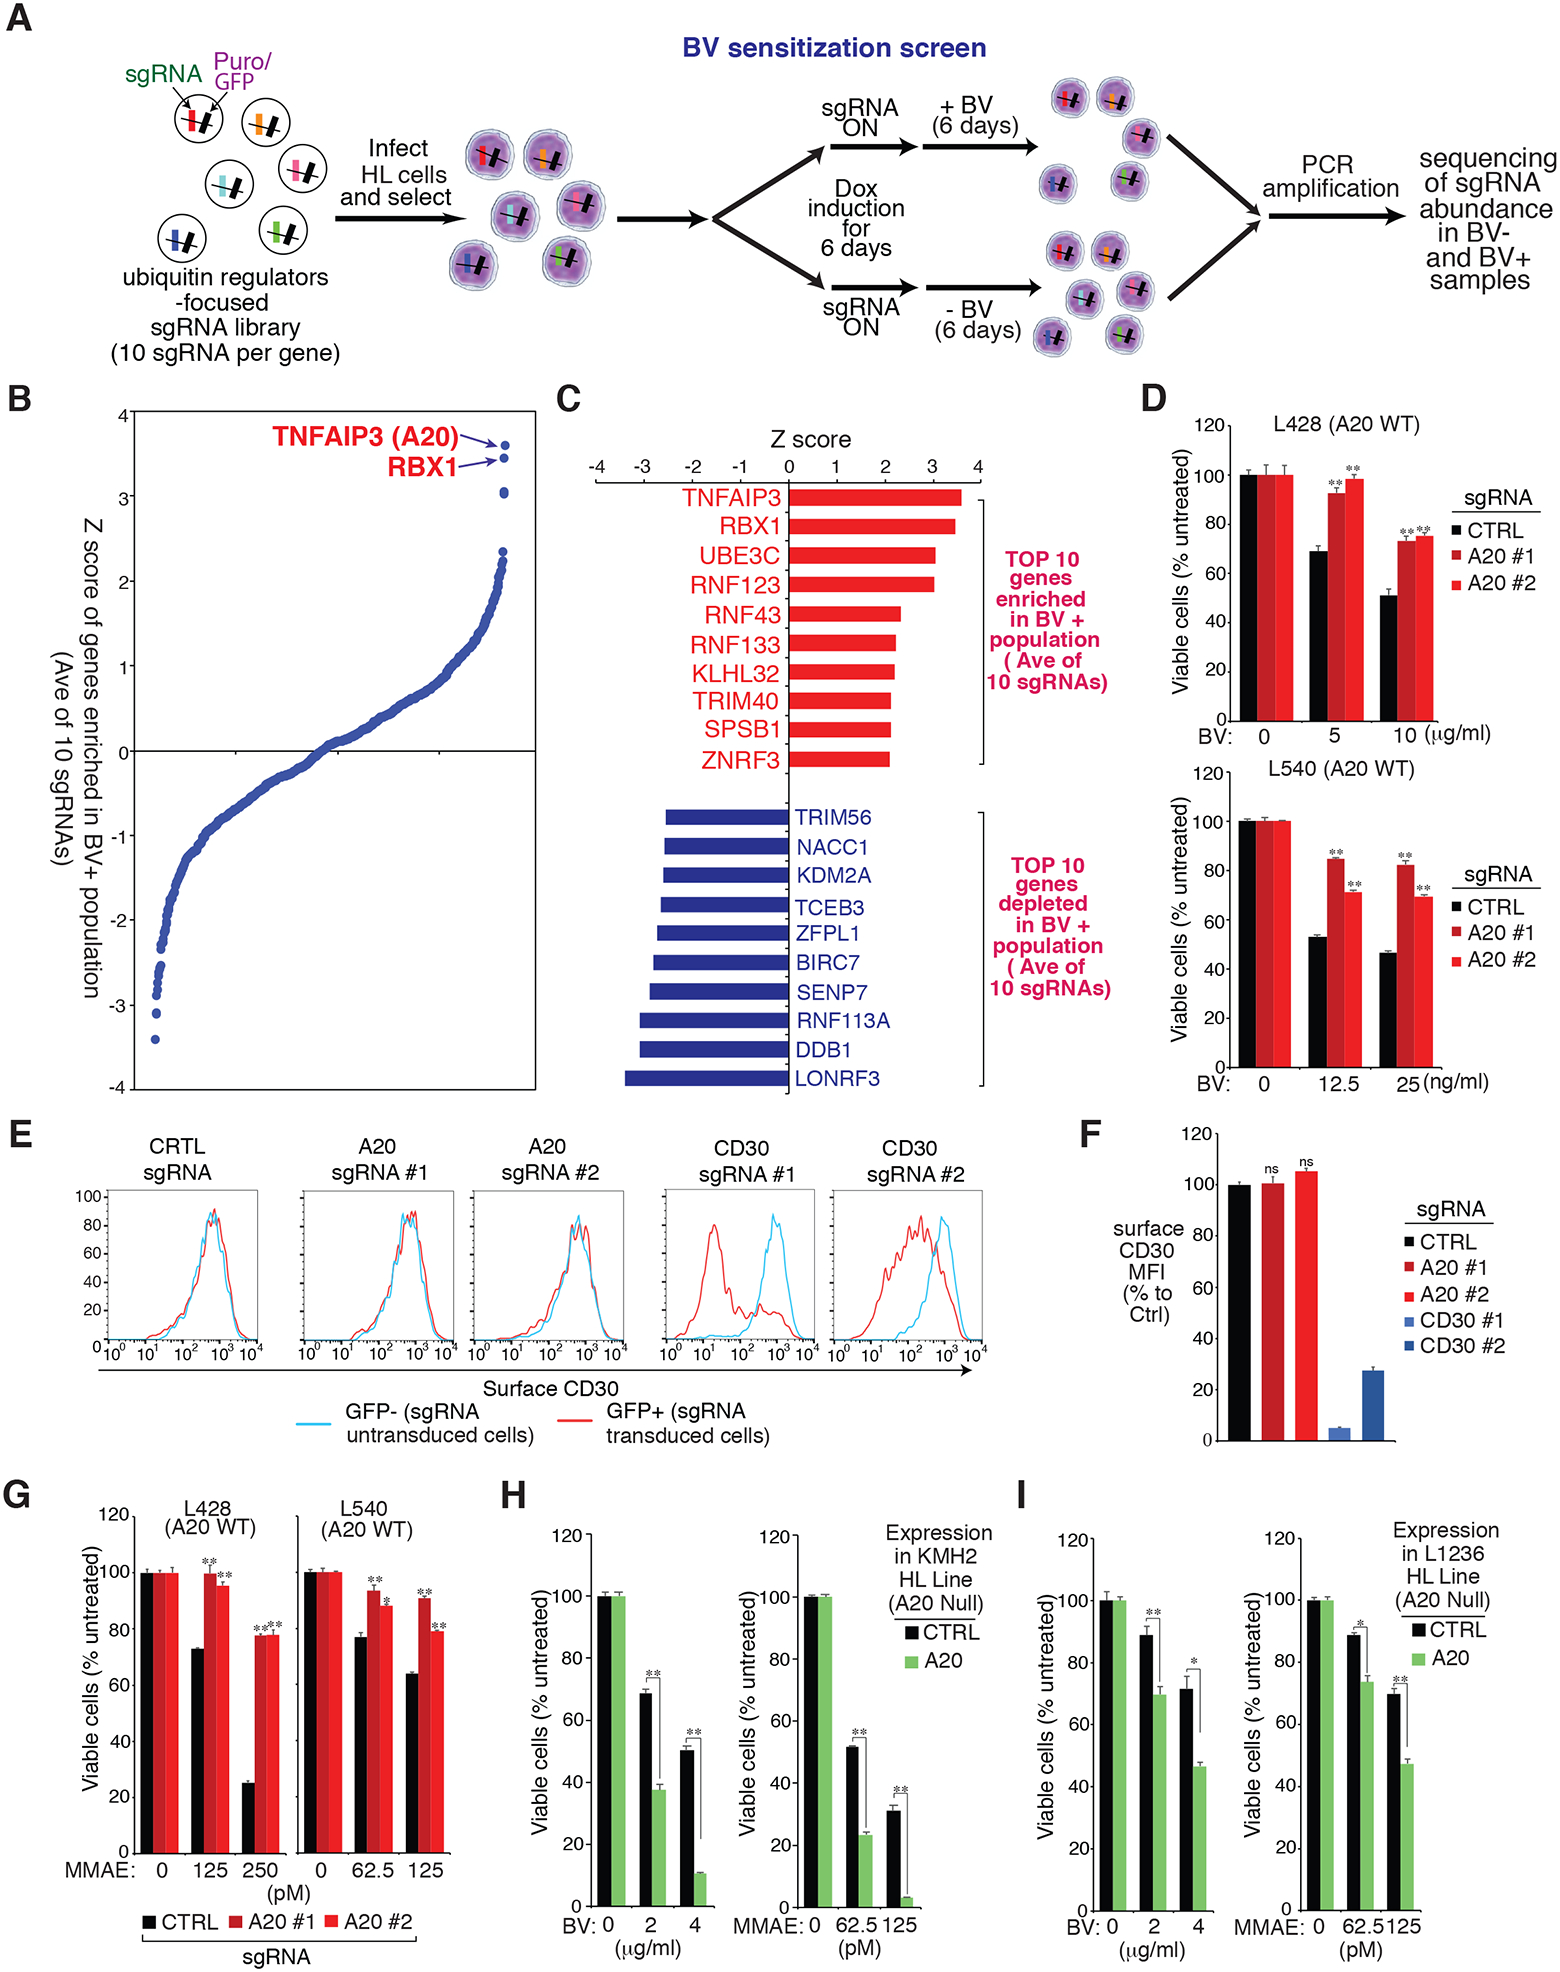
Figure 1: BV sensitization CRISPR library screen in HL line.

A. Outline of the workflow of the BV sensitization CRISPR library screen in HL line. B. Shown are the ranking of all the genes (average of 10 sgRNAs of each gene) enriched in the treated (BV+) population of the L428 line. Y axis indicates the distribution of standardized enrichment scores (Z-scores) of each gene enrichment. C. List of top 10 genes enriched (upper) or depleted (lower) in the treated (BV+) of L428 line. Y axis indicates the distribution of standardized enrichment scores (Z-scores) of each gene enrichment. D. HL cell lines L428 and L540 were transduced with A20 or Ctrl sgRNAs, selected and expression induced, then treated with BV at the indicated concentrations for 4 days. Viability was measured by the MTS assay and normalized to PBS-treated cells. E. HL cell line L428 was transduced with A20, CD30 or Ctrl sgRNAs along with GFP, and sgRNAs expressions were induced for 4 days. Surface CD30 expression in uninfected (GFP−) cells and sgRNA infected (GFP+) cells was measured by flow cytometry. One of the representative experiments is shown. F. As in the E. the summary of three independent experiments are shown. The relative CD30 MFI was normalized to the uninfected (GFP−) cells. G. The HL cell lines L428 and L540 were transduced with A20 or Ctrl sgRNAs, selected and expression induced, then treated with MMAE at the indicated concentrations for 4 days. Viability was measured by MTS assay and normalized to DMSO-treated cells. H and I. A20 deficient HL cell lines KMH2 (H) and L1236 (I) were transduced with A20 cDNA or an empty control, selected and expression induced, then treated with BV or MMAE at the indicated concentrations for 4 days. Viability was measured by an MTS assay and normalized to PBS-treated or DMSO-treated cells. For all panels, error bars denote SEM of triplicates. P were calculated comparing Ctrl and A20 sgRNA transduced groups, or Ctrl and A20 expression groups; * indicates P < 0.05; ** indicates P < 0.01; n.s indicates no statistical difference.
