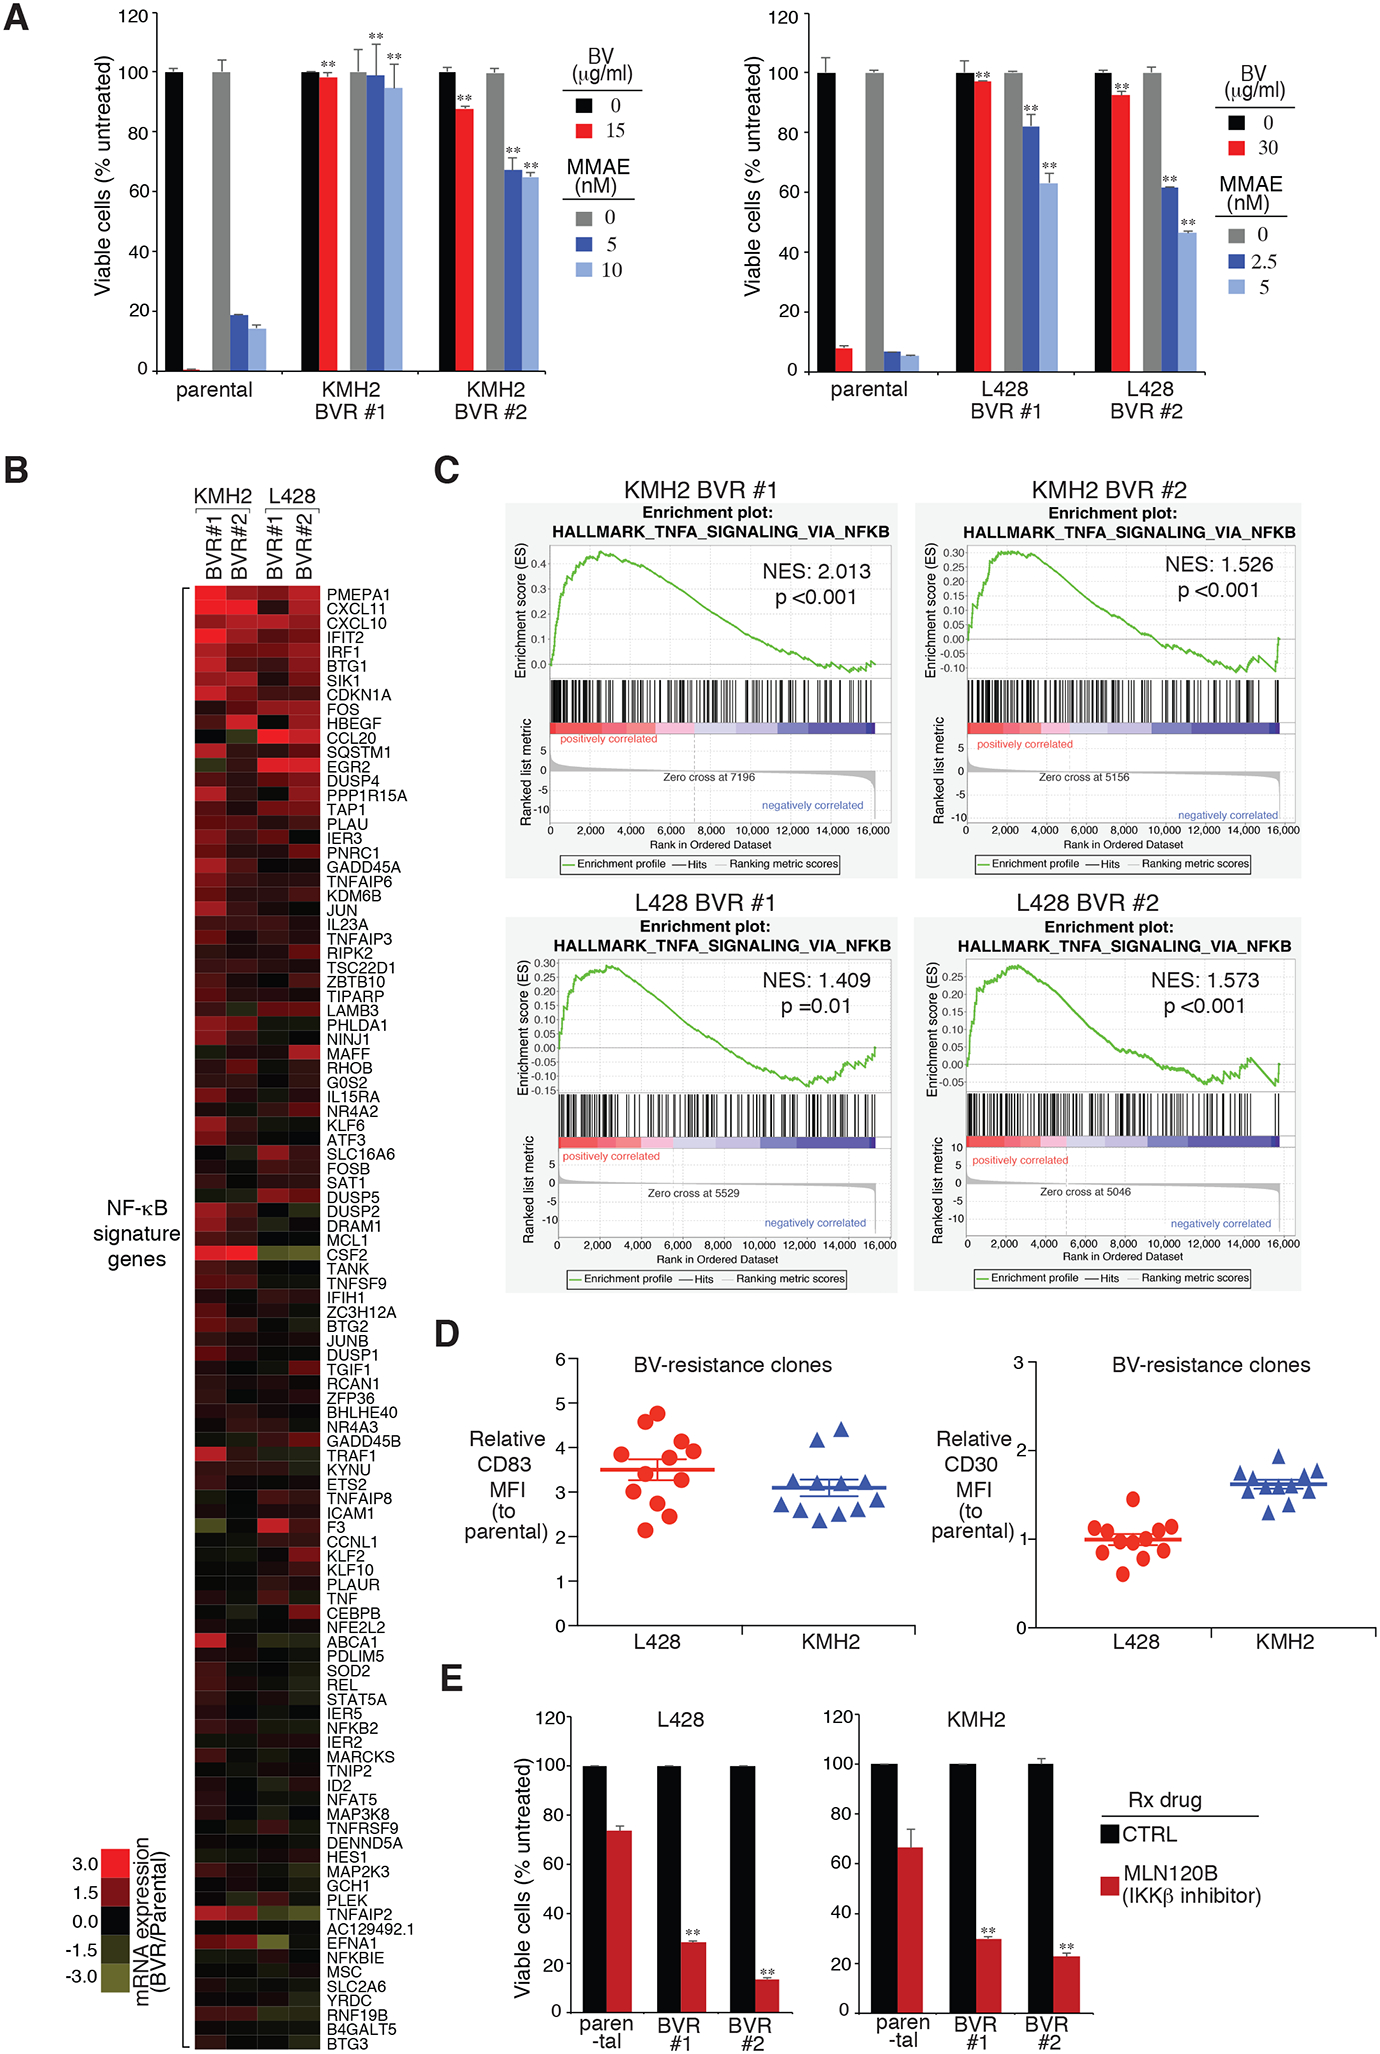
Figure 3: Analysis of BV-resistant single cell clones of HL line.

A. Two individual BV-resistant single cell clones of KMH2 and L428 HL lines, as well as their parental controls, were treated with BV or MMAE at the indicated concentrations for 4 days. Viability was measured by MTS assay and normalized to PBS-treated or DMSO-treated cells. Error bars denote SEM of triplicates. P were calculated comparing BV-resistant clones and its parental controls under the same treatment. ** indicates P < 0.01. B. Heatmap of mRNA induction of NF-κB signature genes in the indicated BV-resistant single cell clones of KMH2 and L428 HL lines, relative to their parental controls. C. GSEA of NF-κB signatures. The analysis was based on BV-resistant clones vs. parental controls in KMH2 and L428 lines. Normalized enrichment score (NES) and normalized (NOM) P value are shown. D. Surface CD83 and CD30 expression were measured in BV-resistant single cell clones of KMH2 and L428 HL lines, as well as their parental controls, by flow cytometry. The relative CD83 MFI was normalized to the parental controls. Error bars denote SEM. E. Two individual BV-resistant single cell clones of KMH2 and L428 HL lines, as well as their parental controls, were treated with MLN120B (80μM) for 3 days. Cell numbers were counted by flow cytometry and normalized to DMSO-treated cells. Error bars denote SEM of triplicates. P were calculated comparing BV-resistant clones and its parental controls under the same treatment. ** indicates P < 0.01.
