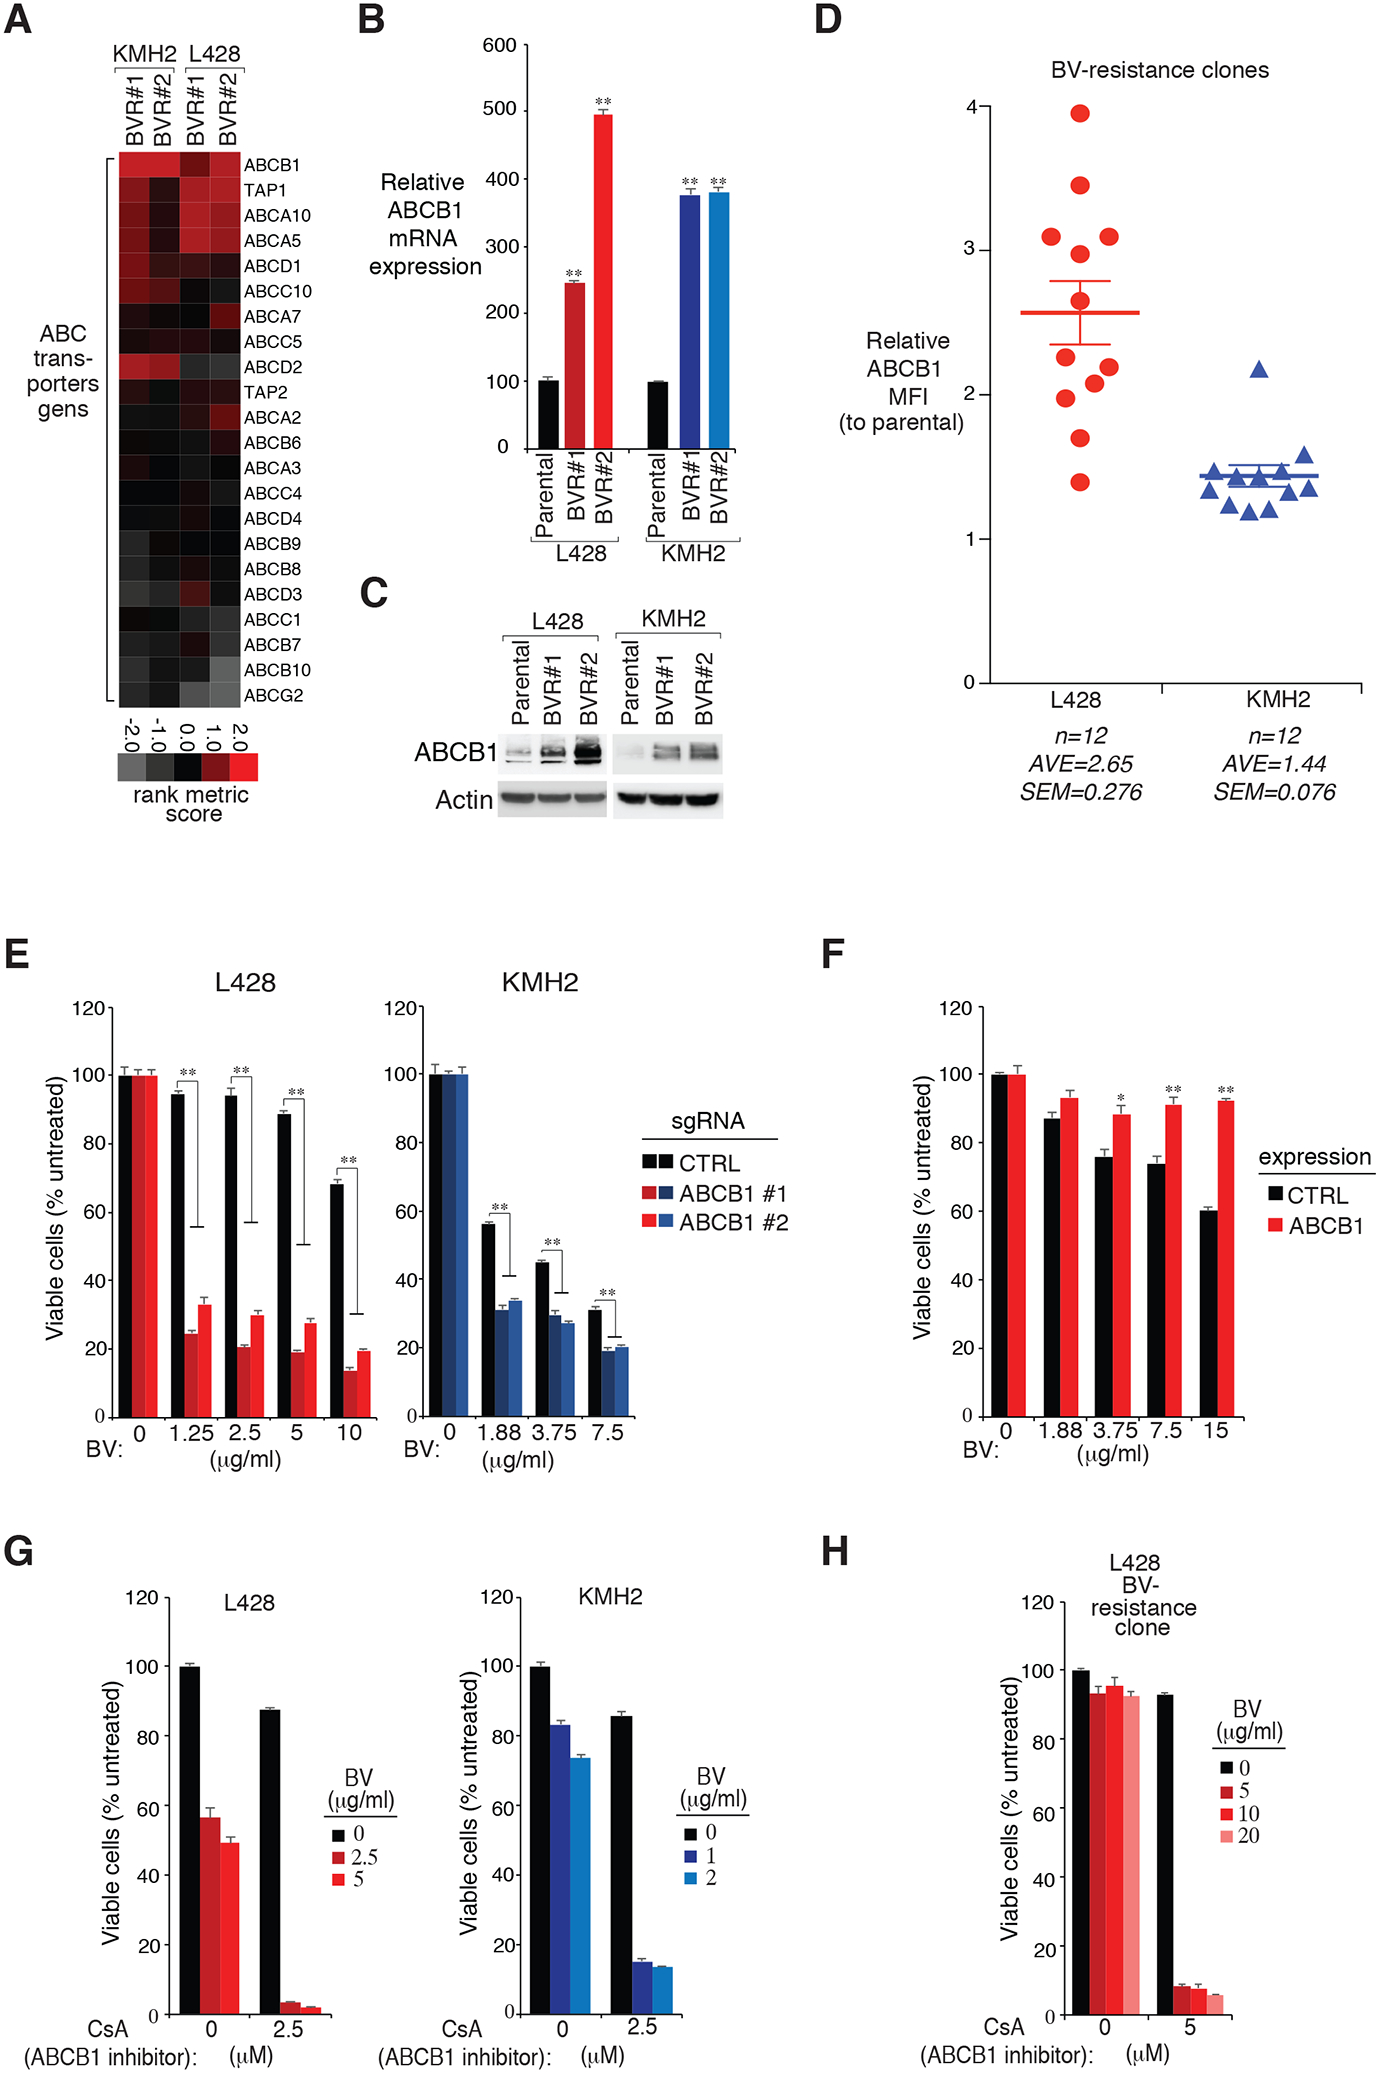
Figure 4: ABCB1 expression is essential for BV sensitivity.

A. Heatmap of rank metric scores of ABC transporter genes in the indicated BV-resistant single cell clones of KMH2 and L428 HL lines, relative to their parental controls. B. and C. ABCB1 expression in two individual BV-resistant single cell clones of KMH2 and L428 HL lines, as well as their parental controls, measured by real-time PCR (B) and immunoblot (C). P were calculated comparing BV-resistant clones and its parental controls. ** indicates P < 0.01. D. Surface ABCB1 expression was measured in all BV-resistant single cell clones of KMH2 and L428 HL lines, as well as their parental controls, by flow cytometry. The relative CD83 MFI was normalized to the parental controls. Error bars denote SEM. E. HL cell lines L428 and KMH2 were transduced with ABCB1 or Ctrl sgRNAs, selected and expression induced, then treated with BV at the indicated concentrations for 4 days. Viability was measured by MTS assay and normalized to PBS-treated cells. Error bars denote SEM of triplicates. ** indicates P < 0.01. F. HL cell line L428 was transduced with ABCB1 cDNA or empty control, selected and expression induced, then treated with BV at the indicated concentrations for 4 days. Viability was measured by MTS assay and normalized to PBS-treated cells. Error bars denote SEM of triplicates. * indicates P < 0.05; ** indicates P < 0.01. G. Viability of HL cell lines KMH2, and L428 after treatment (4 days) with the indicated concentrations of BV, ABCB1 inhibitor CsA, or both. Data are normalized to PBS-treated cells. Error bars denote SEM of triplicates. H. Viability of a L428 BV-resistance line after treatment (4 days) with the indicated concentrations of BV, ABCB1 inhibitor CsA, or both. Data are normalized to DMSO-treated cells. Error bars denote SEM of triplicates.
